Fig. 3.
Download original image
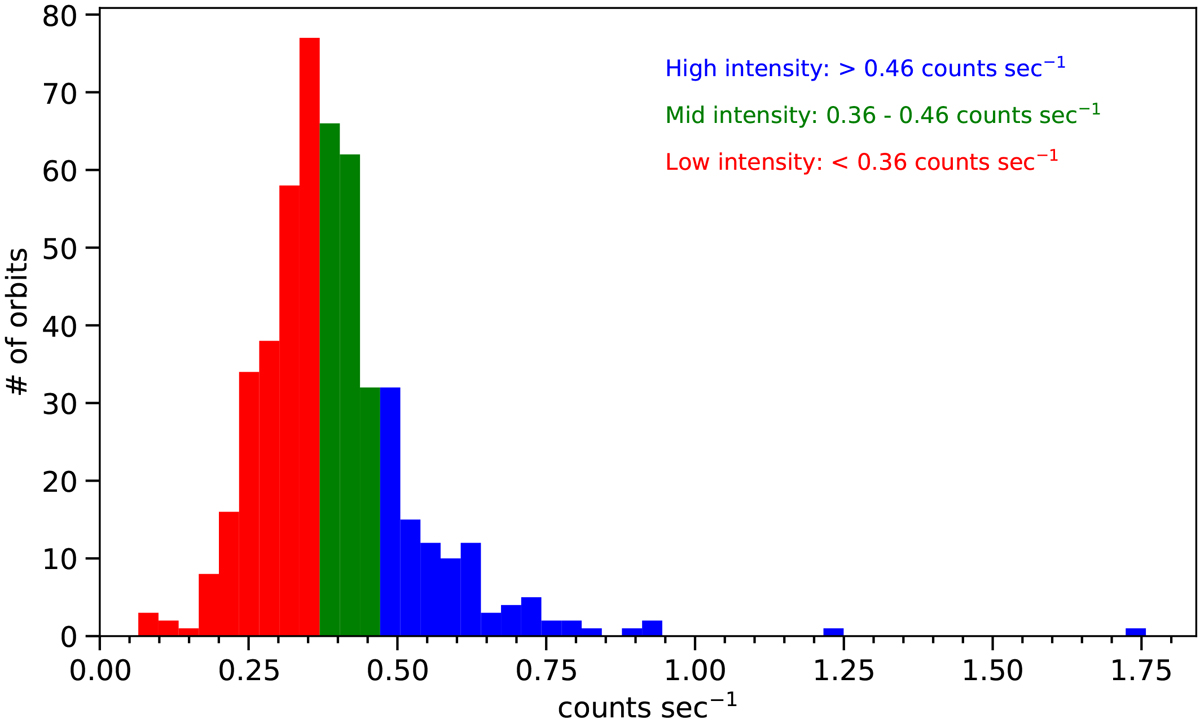
Histogram of total intensity per orbit grouped into three intensity levels. The X axis represents the MAXI/GSC counts rate per orbit. The Y axis represents the number of orbits. The counts rate range for the low (red), mid (green), and high (blue) intensity levels are < 0.36 counts s−1, 0.36 − 0.46 counts s−1, and > 0.46 counts s−1, respectively. The total number of orbits in the three intensity levels are 222, 161, and 111, respectively.
Current usage metrics show cumulative count of Article Views (full-text article views including HTML views, PDF and ePub downloads, according to the available data) and Abstracts Views on Vision4Press platform.
Data correspond to usage on the plateform after 2015. The current usage metrics is available 48-96 hours after online publication and is updated daily on week days.
Initial download of the metrics may take a while.