Open Access
Fig. 1.
Download original image
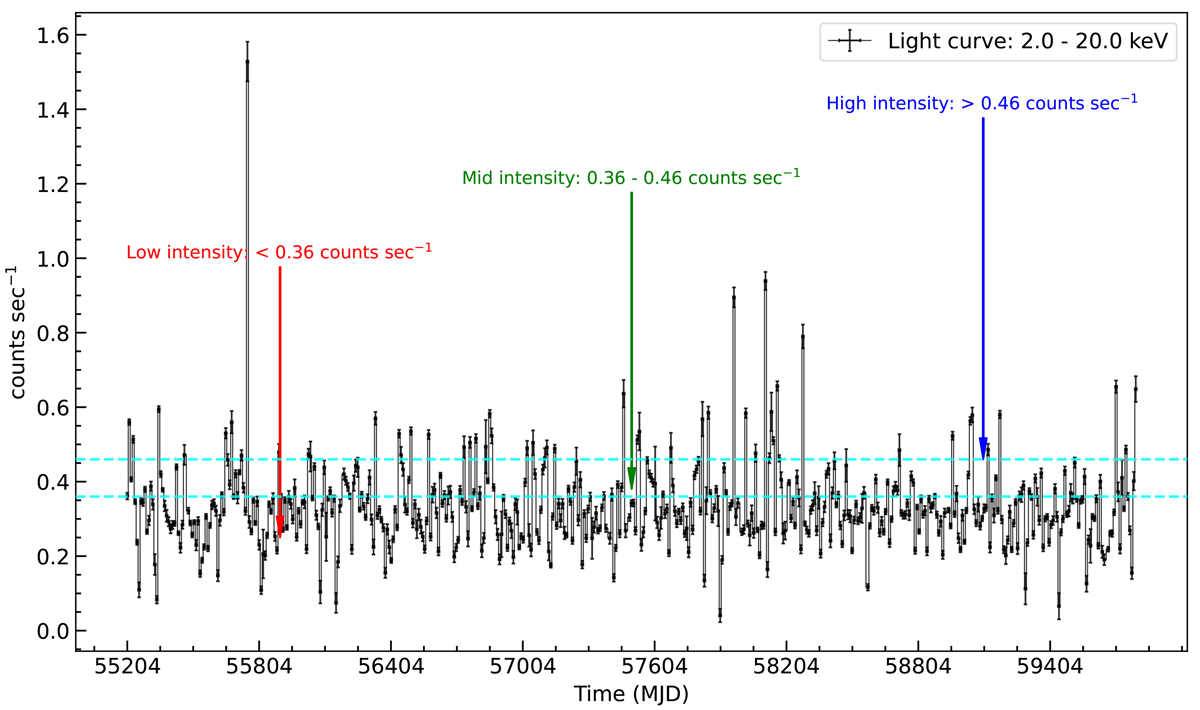
∼13-year long-term MAXI/GSC light curve of Vela X−1 with a bin size of one orbital period. The red, green, and blue arrows mark the low (< 0.36 counts s−1), mid (0.36−0.46 counts s−1), and high (> 0.46 counts s−1) intensity levels. The horizontal lines (cyan) separate the three intensity levels.
Current usage metrics show cumulative count of Article Views (full-text article views including HTML views, PDF and ePub downloads, according to the available data) and Abstracts Views on Vision4Press platform.
Data correspond to usage on the plateform after 2015. The current usage metrics is available 48-96 hours after online publication and is updated daily on week days.
Initial download of the metrics may take a while.