Open Access
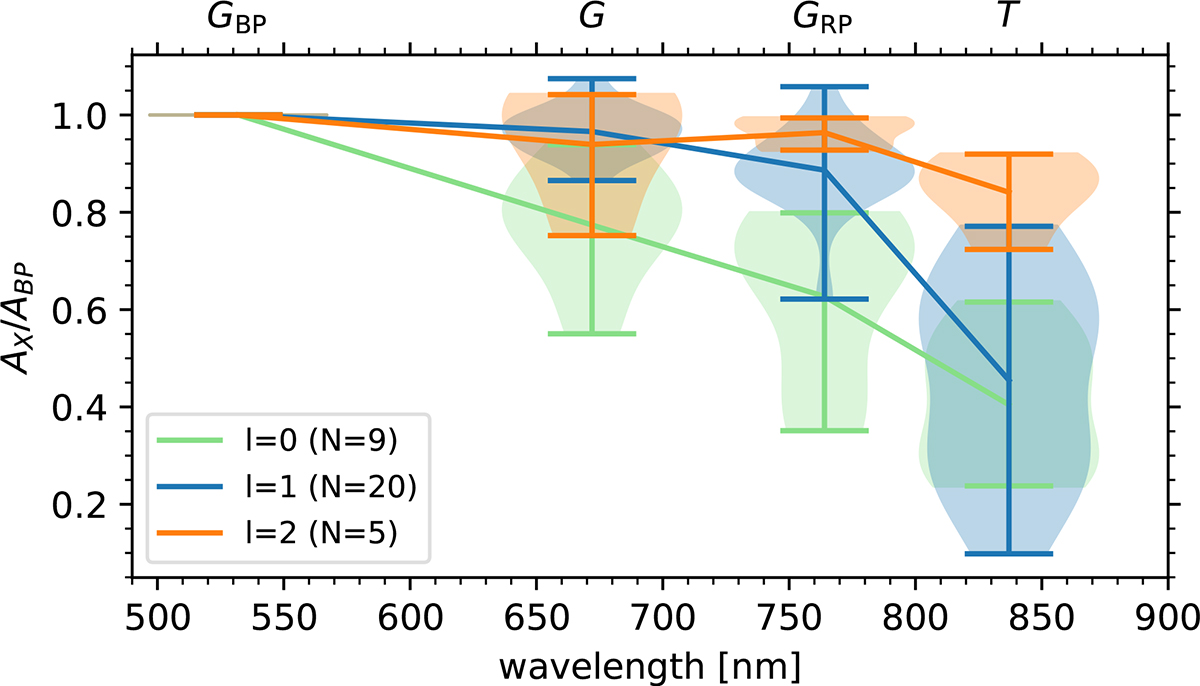
Fig. 9.
Download original image
Violin plots of amplitude ratios for identified pulsation modes over the filter's effective wavelengths. The lines connect the mean values for each mode degree. The filter names are given at the top. The GRP and T filters are displaced by ±30 nm to avoid overlapping distributions.
Current usage metrics show cumulative count of Article Views (full-text article views including HTML views, PDF and ePub downloads, according to the available data) and Abstracts Views on Vision4Press platform.
Data correspond to usage on the plateform after 2015. The current usage metrics is available 48-96 hours after online publication and is updated daily on week days.
Initial download of the metrics may take a while.