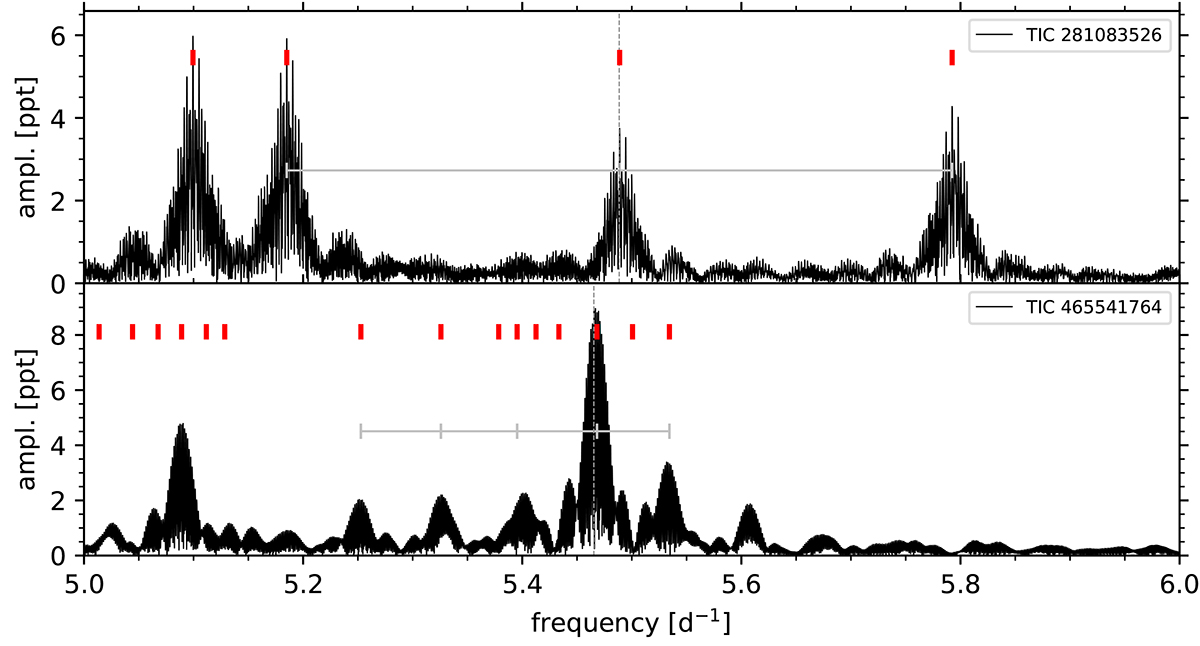
Fig. 8.
Download original image
Examples of rotationally split multiplets found in the amplitude spectra of the TESS data. The top panel shows an l = 1 mode split into three azimuthal components. The bottom panel shows one of the few identified complete l = 2 multiplets. The splittings are marked with grey markers connected by a line. The red markers at the top of each panel indicate the extracted frequencies from pre-whitening. The dashed lines mark the dominant frequency in the Gaia DR3 light curve.
Current usage metrics show cumulative count of Article Views (full-text article views including HTML views, PDF and ePub downloads, according to the available data) and Abstracts Views on Vision4Press platform.
Data correspond to usage on the plateform after 2015. The current usage metrics is available 48-96 hours after online publication and is updated daily on week days.
Initial download of the metrics may take a while.