Fig. 3.
Download original image
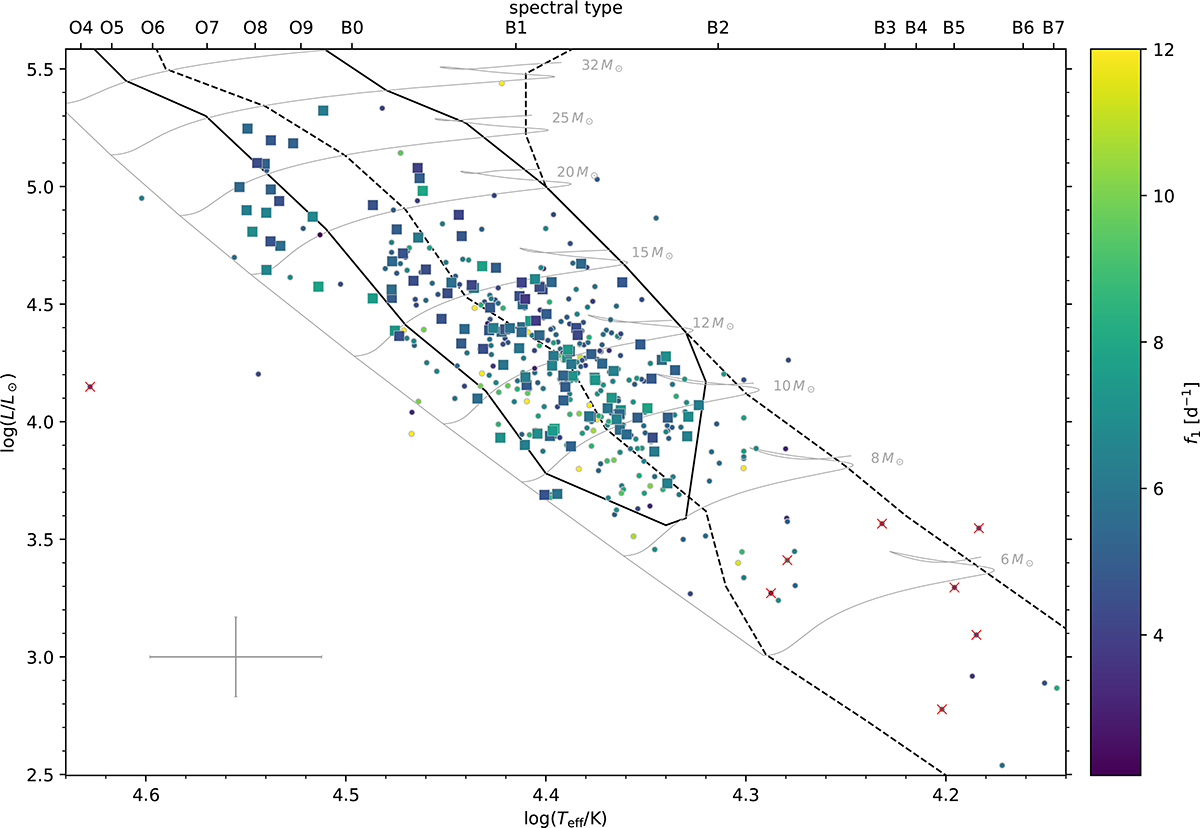
Hertzsprung-Russell diagram based on Gaia data of all 321 β Cep stars from the literature (circles) and the 121 new stars in our Gaia-informed sample (squares, new detections). The typical uncertainty is indicated in the lower left. The black outlines show the instability regions for p-modes (solid, β Cep, l = 0−2), and g-modes (dashed, SPB, l = 1−2) based on the calculations from Burssens et al. (2020). The main sequence evolutionary tracks of Burssens et al. (2020) are shown in grey. The colour-coding gives the main pulsation frequency of the stars cut off at 12 d−1. Stars marked with a red cross do not exhibit β Cep variability in TESS. The top axis marks the spectral type.
Current usage metrics show cumulative count of Article Views (full-text article views including HTML views, PDF and ePub downloads, according to the available data) and Abstracts Views on Vision4Press platform.
Data correspond to usage on the plateform after 2015. The current usage metrics is available 48-96 hours after online publication and is updated daily on week days.
Initial download of the metrics may take a while.