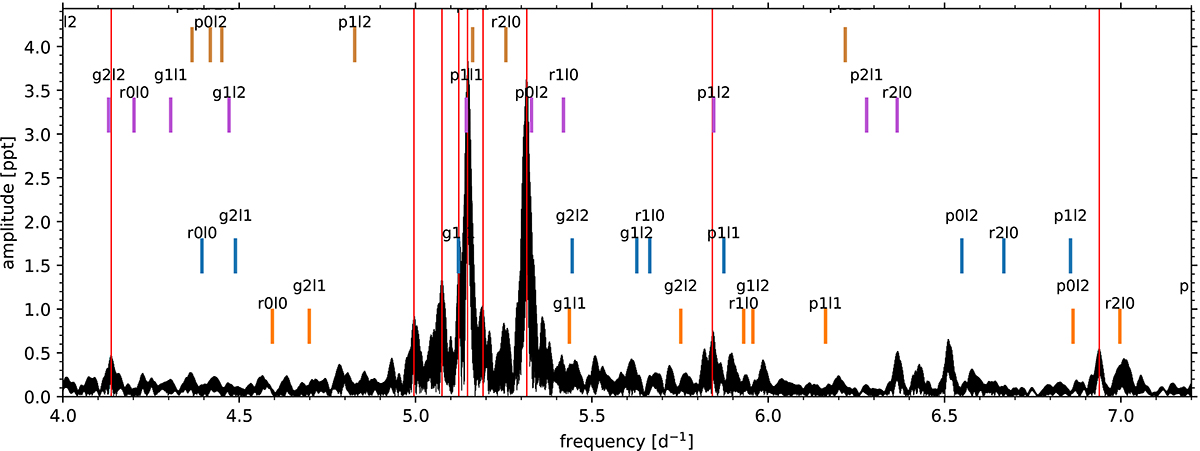
Fig. C.1.
Download original image
Diagnostic plot to identify the radial order n. In the background, we show in black the frequency spectrum of TIC 105756939. The thin red vertical lines indicate the positions of extracted frequencies. The short coloured lines show the positions of the model predictions for the modes of different radial orders. From bottom to top, we show we show n=−2,−1,1,2 in orange, blue, purple, brown, respectively.
Current usage metrics show cumulative count of Article Views (full-text article views including HTML views, PDF and ePub downloads, according to the available data) and Abstracts Views on Vision4Press platform.
Data correspond to usage on the plateform after 2015. The current usage metrics is available 48-96 hours after online publication and is updated daily on week days.
Initial download of the metrics may take a while.