Fig. 2.

Download original image
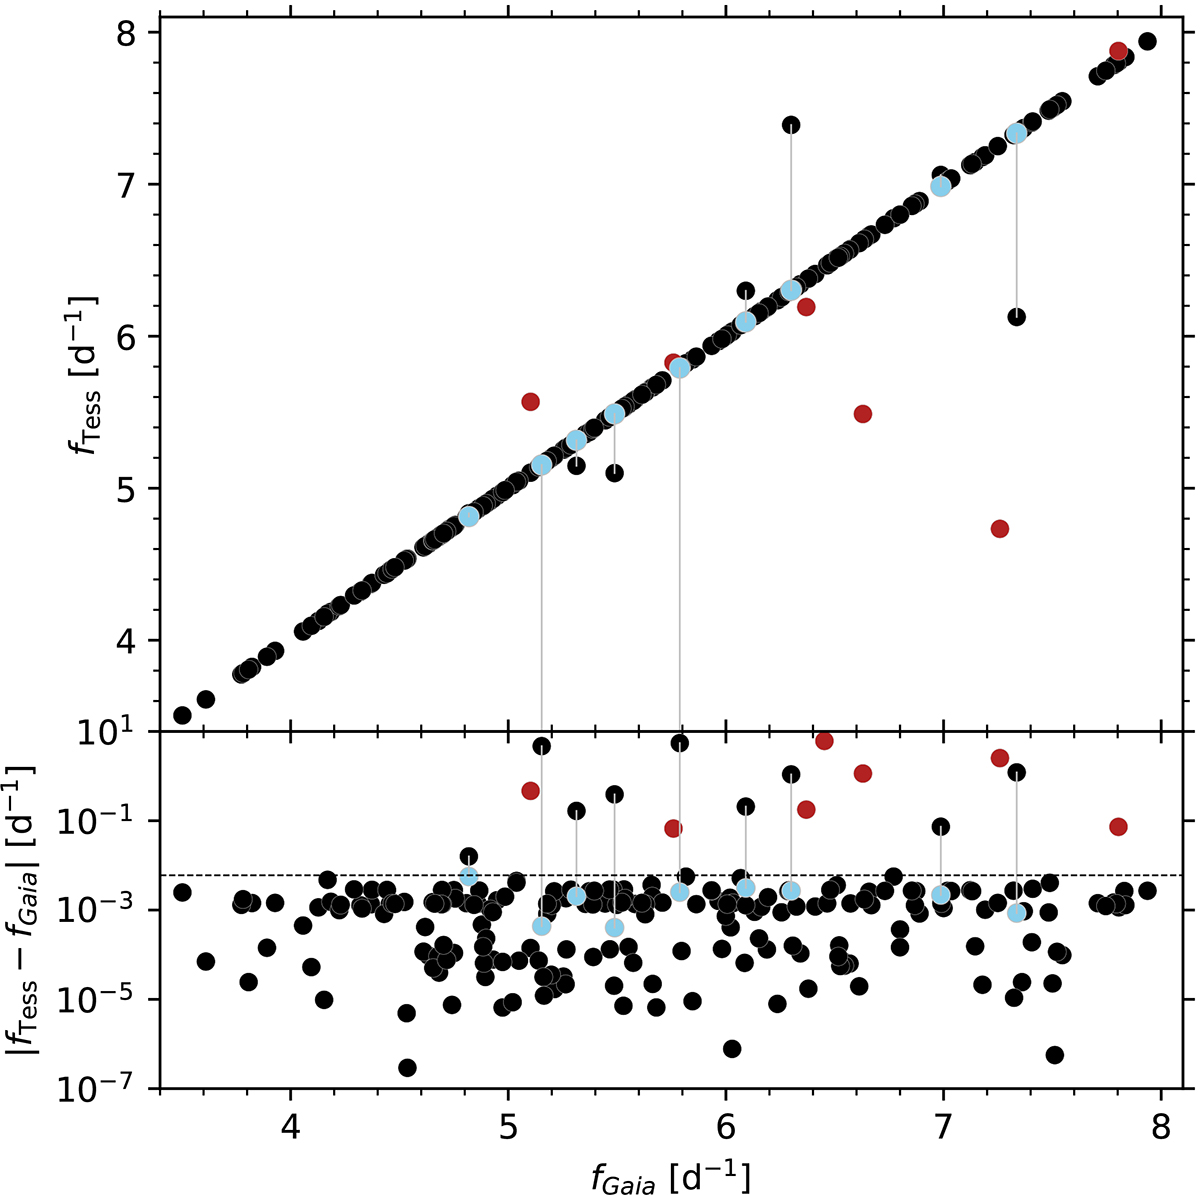
Comparison between the highest amplitude Gaia and TESS frequencies for the 215 stars with significant TESS frequencies. Top: Dominant TESS frequency fTESS against the Gaia derived frequency fGaia. The black symbols indicate stars for which we found a match in frequency, the blue symbols show stars matching a frequency other than the dominant signal, and the red symbols indicate the seven stars for which the Gaia frequency does not match any frequency in the TESS data. The lines connect the offset frequencies to the matched counterpart. For three stars the main frequency is below the plotting range. Bottom: Difference between the Gaia and TESS frequencies. The black dashed line indicates our chosen threshold for matching signals (Δf<0.006 d−1).
Current usage metrics show cumulative count of Article Views (full-text article views including HTML views, PDF and ePub downloads, according to the available data) and Abstracts Views on Vision4Press platform.
Data correspond to usage on the plateform after 2015. The current usage metrics is available 48-96 hours after online publication and is updated daily on week days.
Initial download of the metrics may take a while.


