Fig. 14.
Download original image
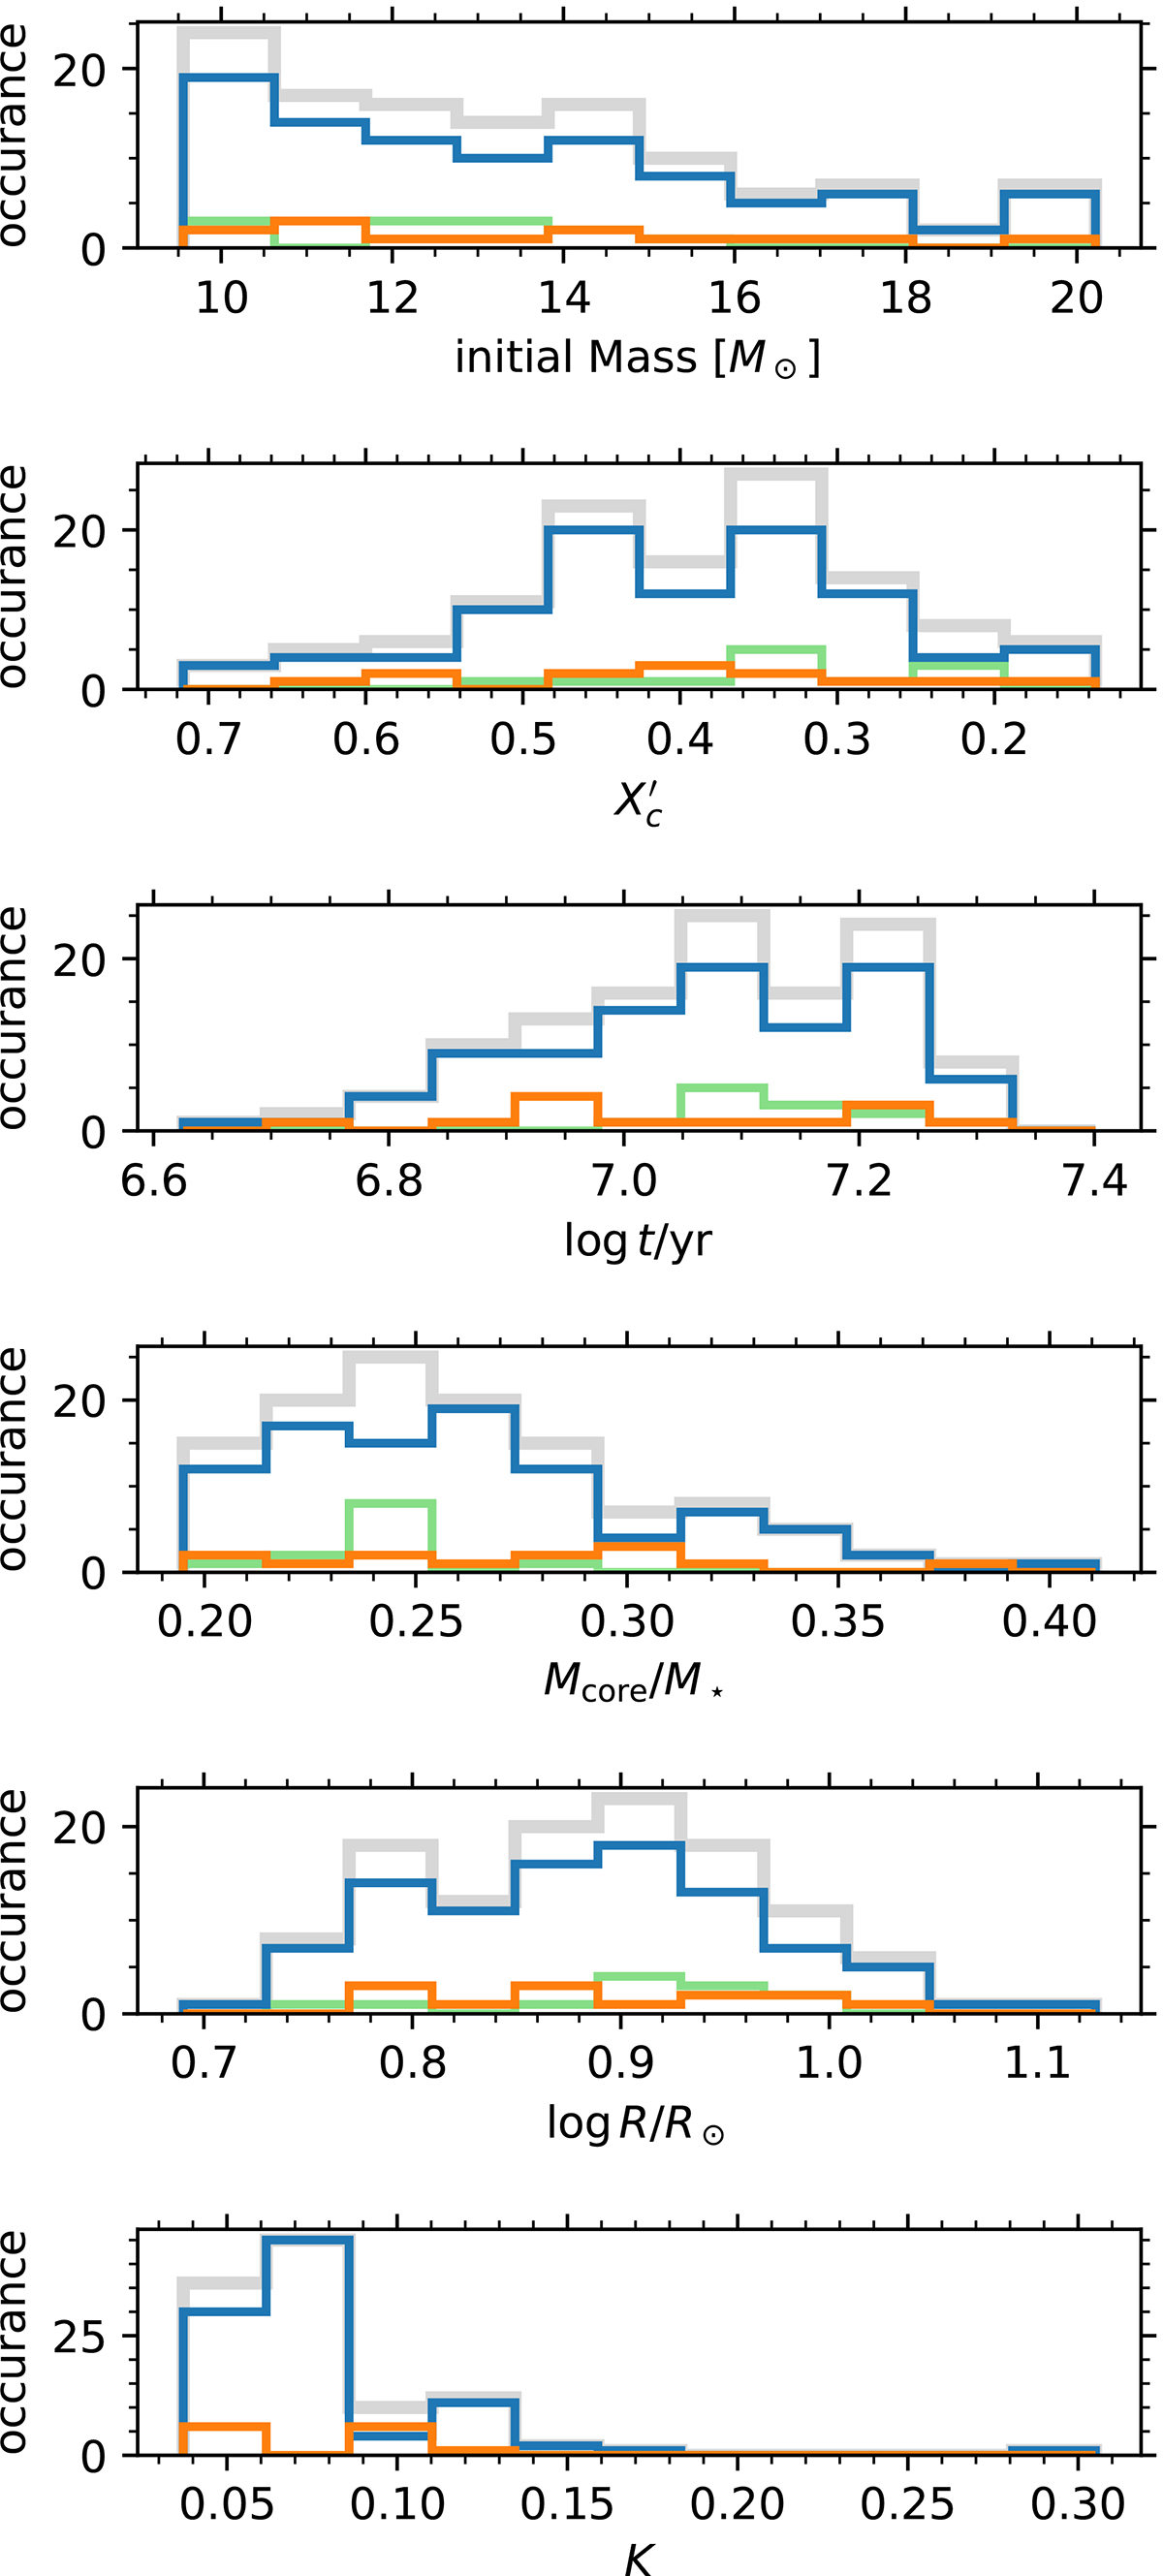
Distribution of β Cep parameters for the modelled stars. Each panel contains the histograms for the full sample (grey) and each degree l = 0 (green), l = 1 (blue), and l = 2 (orange). From top to bottom, these panels show the initial mass distribution, the normalised core hydrogen fraction ![]() , the stellar age in years, the relative convective core mass, the radius, and the K-value.
, the stellar age in years, the relative convective core mass, the radius, and the K-value.
Current usage metrics show cumulative count of Article Views (full-text article views including HTML views, PDF and ePub downloads, according to the available data) and Abstracts Views on Vision4Press platform.
Data correspond to usage on the plateform after 2015. The current usage metrics is available 48-96 hours after online publication and is updated daily on week days.
Initial download of the metrics may take a while.