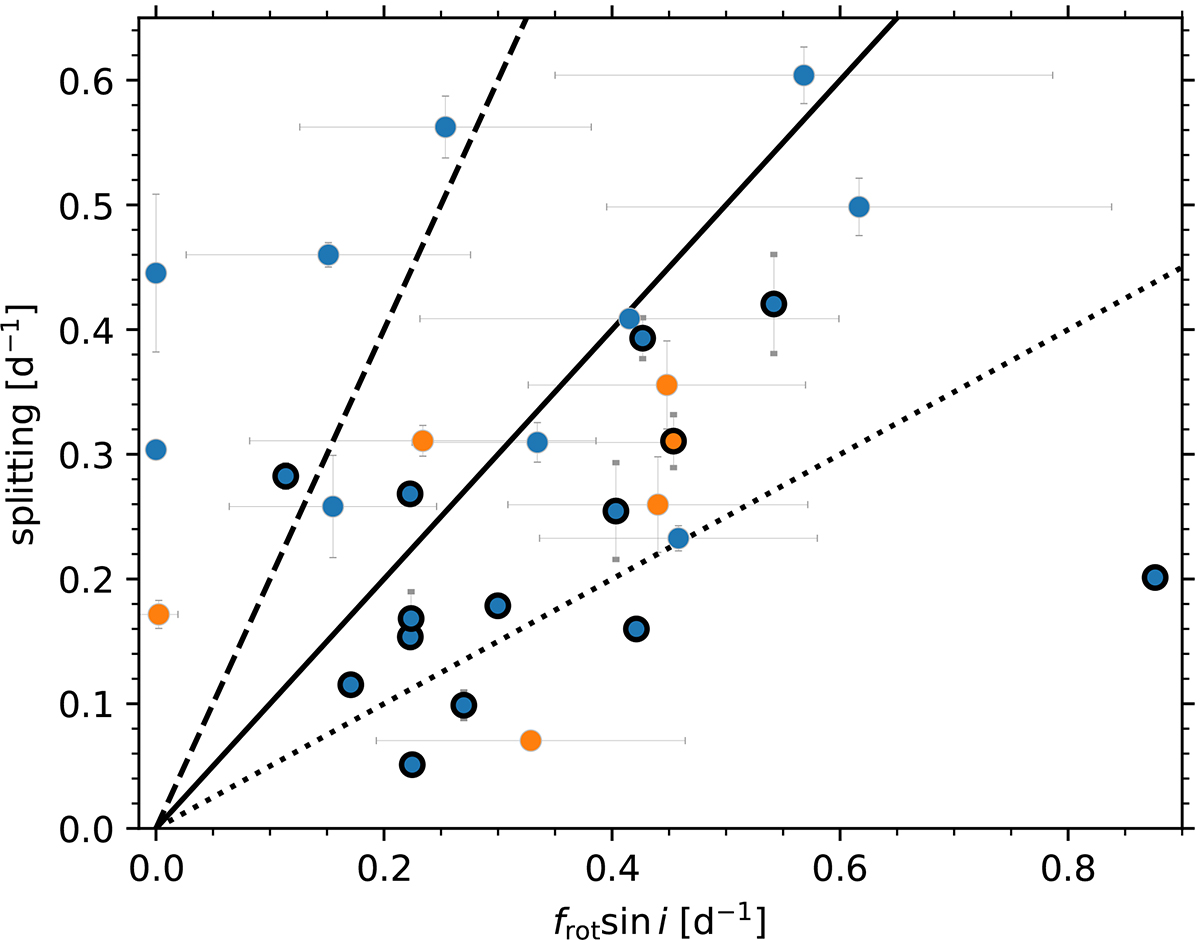
Fig. 12.
Download original image
Observed mode splittings against the projected surface rotation rate (frotsin i, encircled in thin grey) or photometric surface rotation rate (frot, encircled in thick solid black). The three lines show the splitting values when equal to the surface rotation rate (solid) as well as one-half (dotted) and twice (dashed) the surface rotation rate. The uncertainties on the splittings indicate the maximum difference of the individual splittings to the mean splitting of the multiplet and are a measure for the asymmetry. The colours show our deterministic identifications as l = 1 (blue) and l = 2 (orange) modes.
Current usage metrics show cumulative count of Article Views (full-text article views including HTML views, PDF and ePub downloads, according to the available data) and Abstracts Views on Vision4Press platform.
Data correspond to usage on the plateform after 2015. The current usage metrics is available 48-96 hours after online publication and is updated daily on week days.
Initial download of the metrics may take a while.