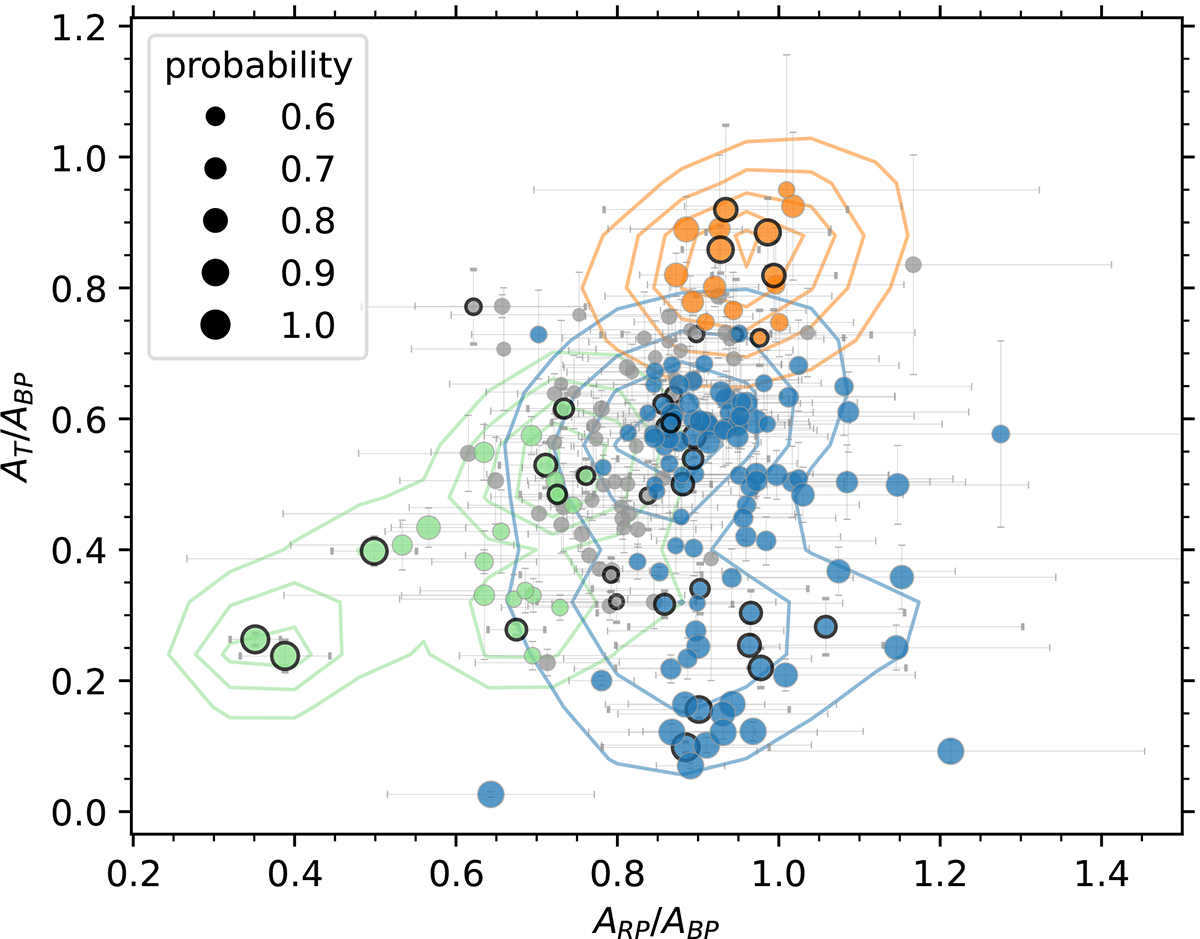
Fig. 11.
Download original image
Amplitude ratio diagram based on ARP/ABP and AT/ABP, similar to Fig. 7. The colour-coding shows the mode degree as determined with our probabilistic framework: l = 0 (green), l = 1 (blue), l = 2 (orange). The grey symbols denote stars with p<0.6. The symbol size is proportional to the probability of the mode identification. The stars marked with black outlines constitute the underlying sample from Fig. 9.
Current usage metrics show cumulative count of Article Views (full-text article views including HTML views, PDF and ePub downloads, according to the available data) and Abstracts Views on Vision4Press platform.
Data correspond to usage on the plateform after 2015. The current usage metrics is available 48-96 hours after online publication and is updated daily on week days.
Initial download of the metrics may take a while.