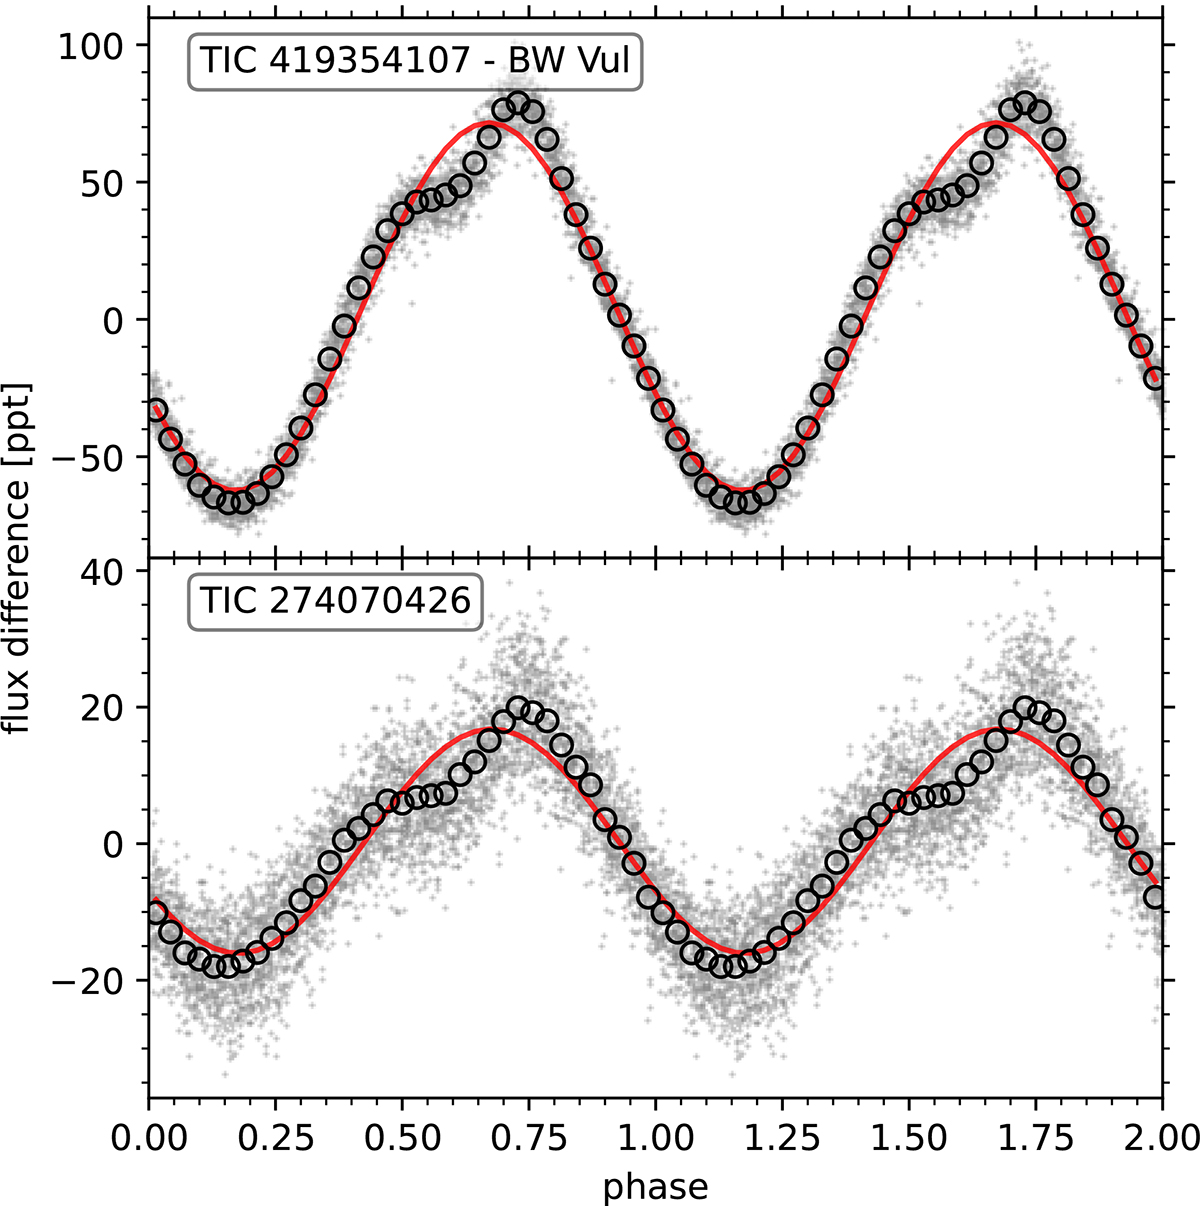
Fig. 10.
Download original image
Light curves folded over the dominant frequency of two stars with clear standstills in our sample (stalling of the light curve near phase 0.5). The folded light curve is binned into 35 bins, shown as black circles, to which we fitted a sinusoidal with a fixed frequency for reference (red). The top panel shows the archetypical standstill star BW Vul (Walker 1954).
Current usage metrics show cumulative count of Article Views (full-text article views including HTML views, PDF and ePub downloads, according to the available data) and Abstracts Views on Vision4Press platform.
Data correspond to usage on the plateform after 2015. The current usage metrics is available 48-96 hours after online publication and is updated daily on week days.
Initial download of the metrics may take a while.