Fig. 1.
Download original image
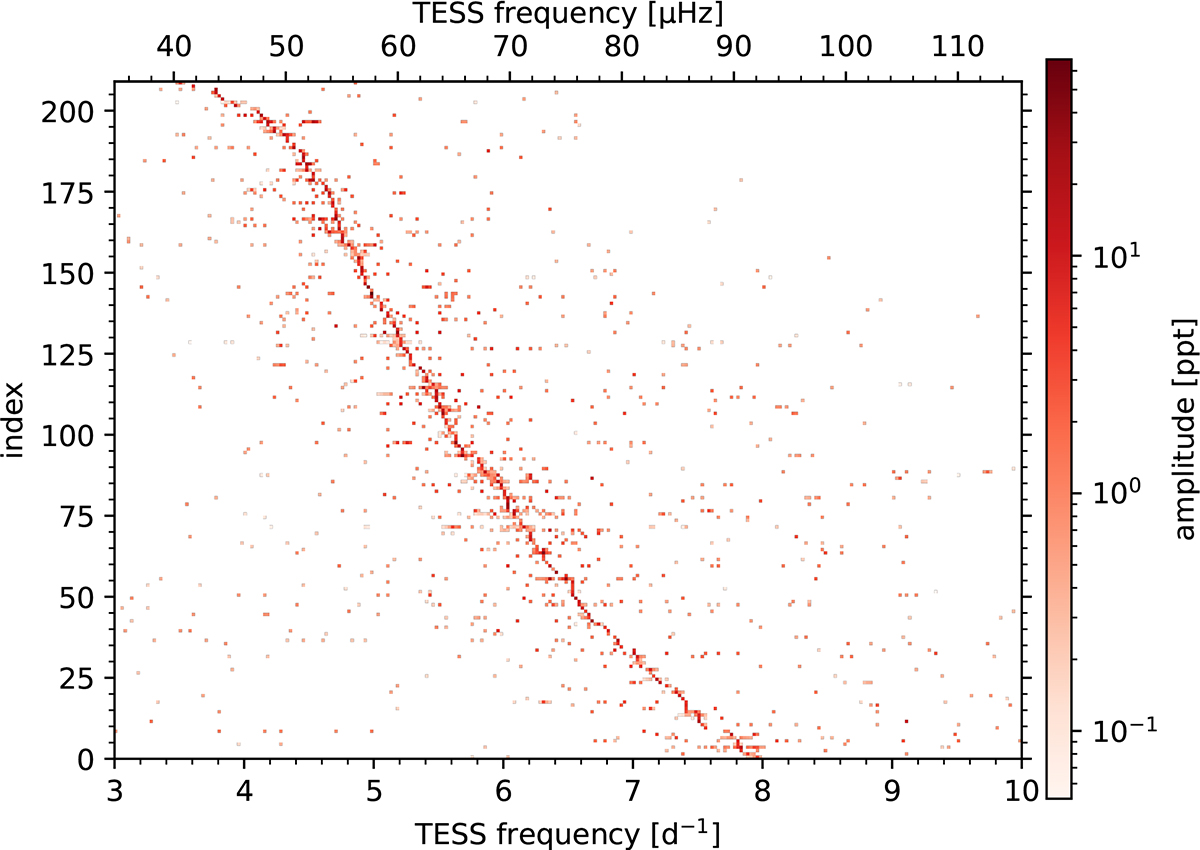
Stacked representation of the extracted independent, significant TESS frequencies for 212 of the Gaia-detected β Cep stars, sorted by the TESS frequency with the largest amplitude. The colour-scale indicates the amplitude of each detected signal on a logarithmic scale. This figure includes only the stars whose main frequency occurs in the plotted β Cep range. Three stars have lower main frequencies and turn out to be SPB stars or β Cep and SPB hybrid pulsators with dominant high-order g-modes, or are dominated by other variability than pulsations.
Current usage metrics show cumulative count of Article Views (full-text article views including HTML views, PDF and ePub downloads, according to the available data) and Abstracts Views on Vision4Press platform.
Data correspond to usage on the plateform after 2015. The current usage metrics is available 48-96 hours after online publication and is updated daily on week days.
Initial download of the metrics may take a while.