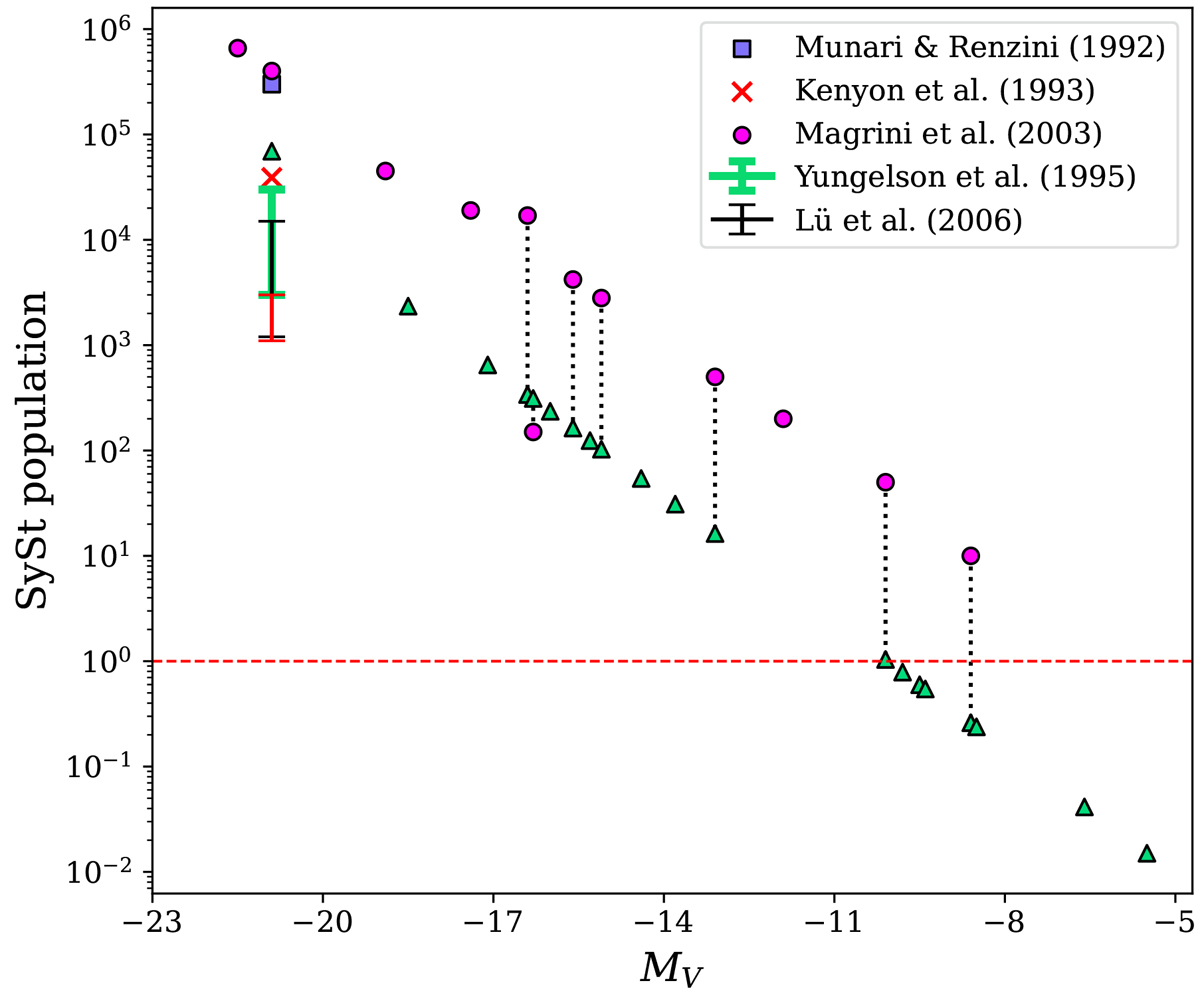
Fig. 9.
Download original image
Local Group SySt population as a function of the galaxy’s visual magnitude. Our results, per galaxy, are shown as green triangles, and their uncertainties are not shown because they are about size of the scatter triangles. The red population range, at MV of about −21, is the lower limit range derived from the empirical approach. Data from Munari & Renzini (1992), Kenyon et al. (1993), Yungelson et al. (1995), Magrini et al. (2003), Lü et al. (2006) are plotted for comparison; the dotted lines connect the same galaxies in different works. The red dashed line marks the unity.
Current usage metrics show cumulative count of Article Views (full-text article views including HTML views, PDF and ePub downloads, according to the available data) and Abstracts Views on Vision4Press platform.
Data correspond to usage on the plateform after 2015. The current usage metrics is available 48-96 hours after online publication and is updated daily on week days.
Initial download of the metrics may take a while.