Fig. 8.
Download original image
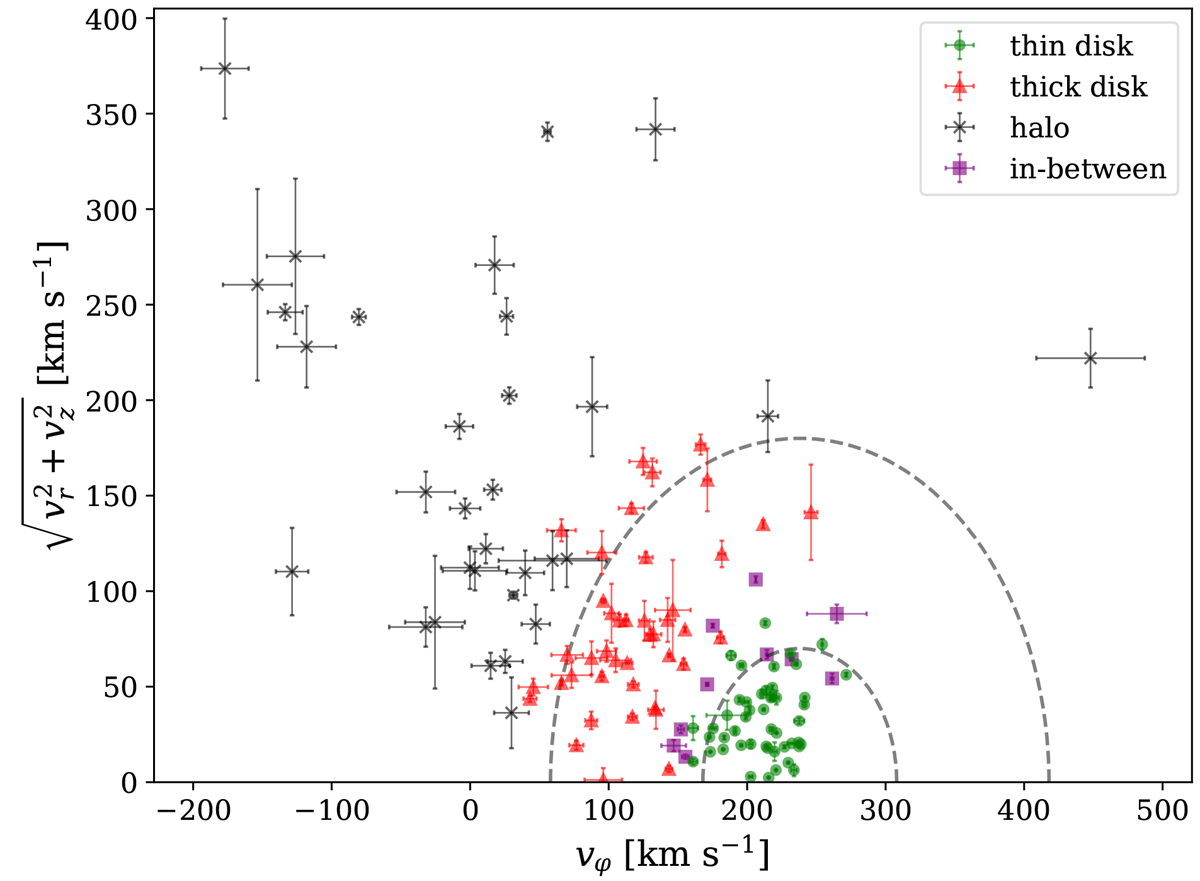
Galactocentric Toomre diagram for confirmed galactic SySts with velocity information. On the horizontal axis we have the circular (azimuthal) velocity component, vφ, and on the vertical axis the squared root of the sum of the squares of the (galactocentric) radial velocity, vr, and vertical velocity, vz. The dashed lines mark constant total velocities (vr2 + vφ2 + vz2)1/2 of 70 and 180 km s−1, centered at the Local Standard of Rest (vφ ≈ 238 km s−1; Reid et al. 2014) for easier visualization. Thus marking the classical boundaries between thin and thick disks. Uncertainties are defined as the standard error, inferred applying a bootstrap analysis (104 drawings for each system). Inferred velocities are displayed in Table 2.
Current usage metrics show cumulative count of Article Views (full-text article views including HTML views, PDF and ePub downloads, according to the available data) and Abstracts Views on Vision4Press platform.
Data correspond to usage on the plateform after 2015. The current usage metrics is available 48-96 hours after online publication and is updated daily on week days.
Initial download of the metrics may take a while.