Open Access
Fig. 3.
Download original image
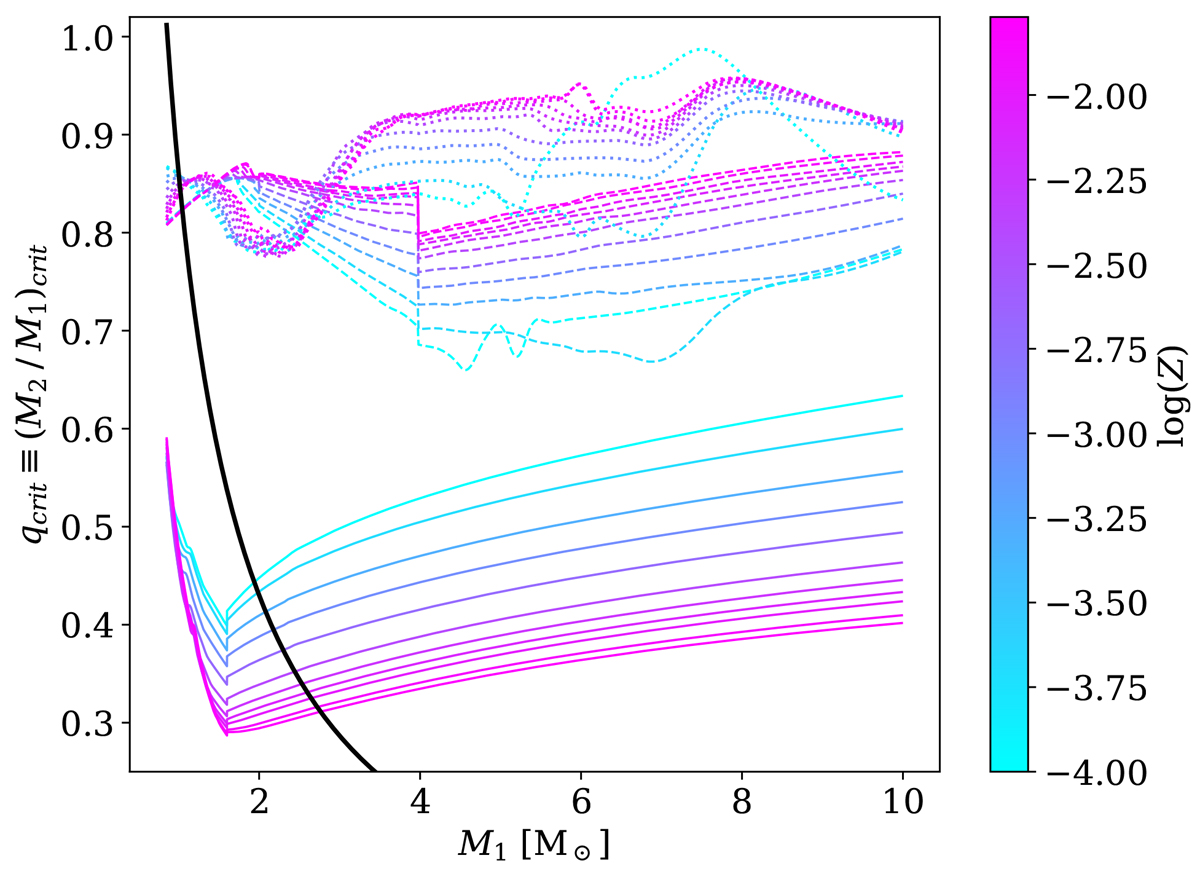
Critical mass ratio as a function of primary mass and metallicity. Solid, dashed and dotted lines represent MS, RGB and AGB, respectively. The black solid curve shows the behavior of qcut(M1). Discontinuities happen because of the changing behavior of the qcrit defining function, and the use of the mean radii.
Current usage metrics show cumulative count of Article Views (full-text article views including HTML views, PDF and ePub downloads, according to the available data) and Abstracts Views on Vision4Press platform.
Data correspond to usage on the plateform after 2015. The current usage metrics is available 48-96 hours after online publication and is updated daily on week days.
Initial download of the metrics may take a while.