Fig. 8.
Download original image
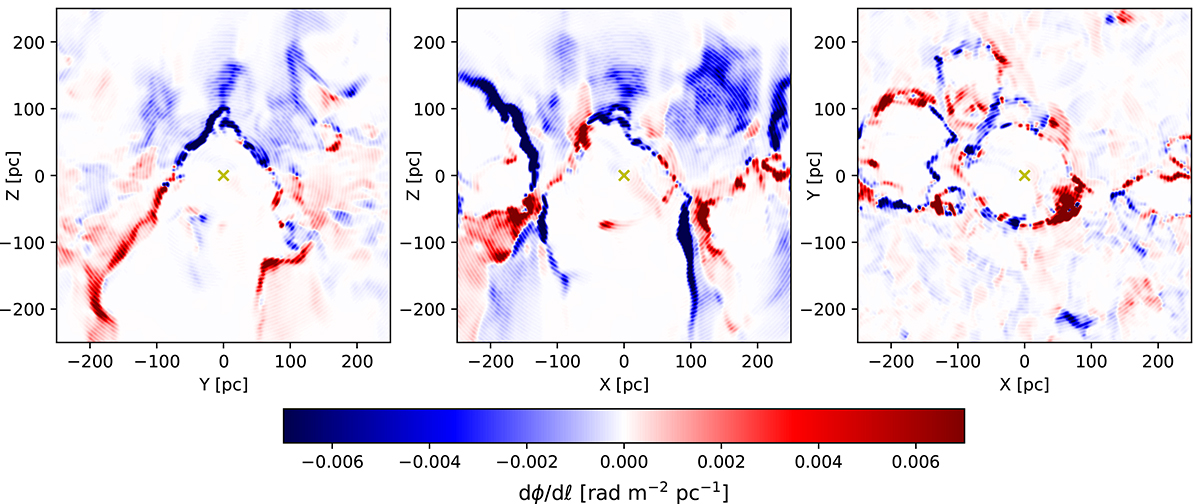
Midplane cuts, as in Fig. 1, but for the first derivative of the Faraday rotation depth along the LOS, dϕ/dℓ=(ϕ(ℓ + dℓ) − ϕ(ℓ))/dℓ, computed from the synthetic observation produced using POLARIS. The red (blue) colors correspond to increases (decreases) in RM along each LOS toward an observer placed at the center of the selected bubble. The position of the observer is marked by a yellow cross. We note that the finite number of shells used to sample the rays causes the regular concentric ring pattern visible in the plots.
Current usage metrics show cumulative count of Article Views (full-text article views including HTML views, PDF and ePub downloads, according to the available data) and Abstracts Views on Vision4Press platform.
Data correspond to usage on the plateform after 2015. The current usage metrics is available 48-96 hours after online publication and is updated daily on week days.
Initial download of the metrics may take a while.