Fig. 5.
Download original image
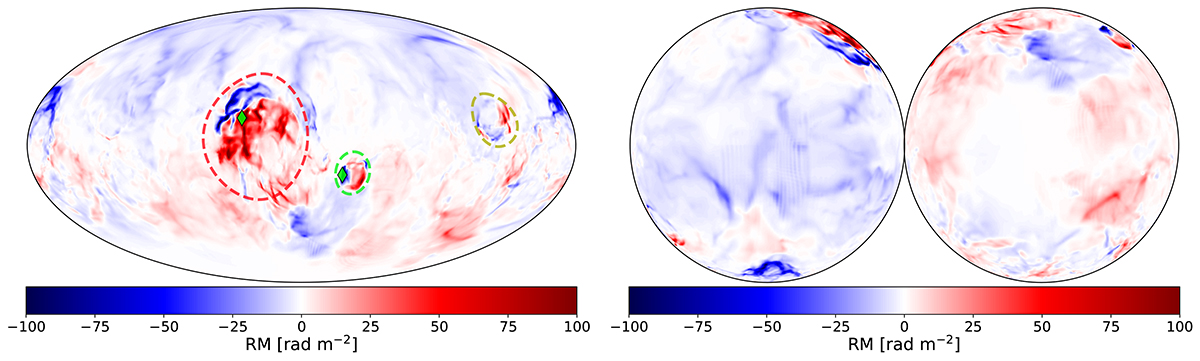
Full-sky RM maps in Mollweide (left) and orthographic projections centered at the galactic poles (right) for our reference case (setup A). The RM signal is internally computed by POLARIS and is obtained using the entire data cube. These maps are addressed in the text as the reference map. Dashed circles indicate the most prominent features corresponding to the regions highlighted in Fig. 2. Marked positions (green diamonds) correspond to minimal RM and maximal RM, respectively, of the total map.
Current usage metrics show cumulative count of Article Views (full-text article views including HTML views, PDF and ePub downloads, according to the available data) and Abstracts Views on Vision4Press platform.
Data correspond to usage on the plateform after 2015. The current usage metrics is available 48-96 hours after online publication and is updated daily on week days.
Initial download of the metrics may take a while.