Fig. 4.
Download original image
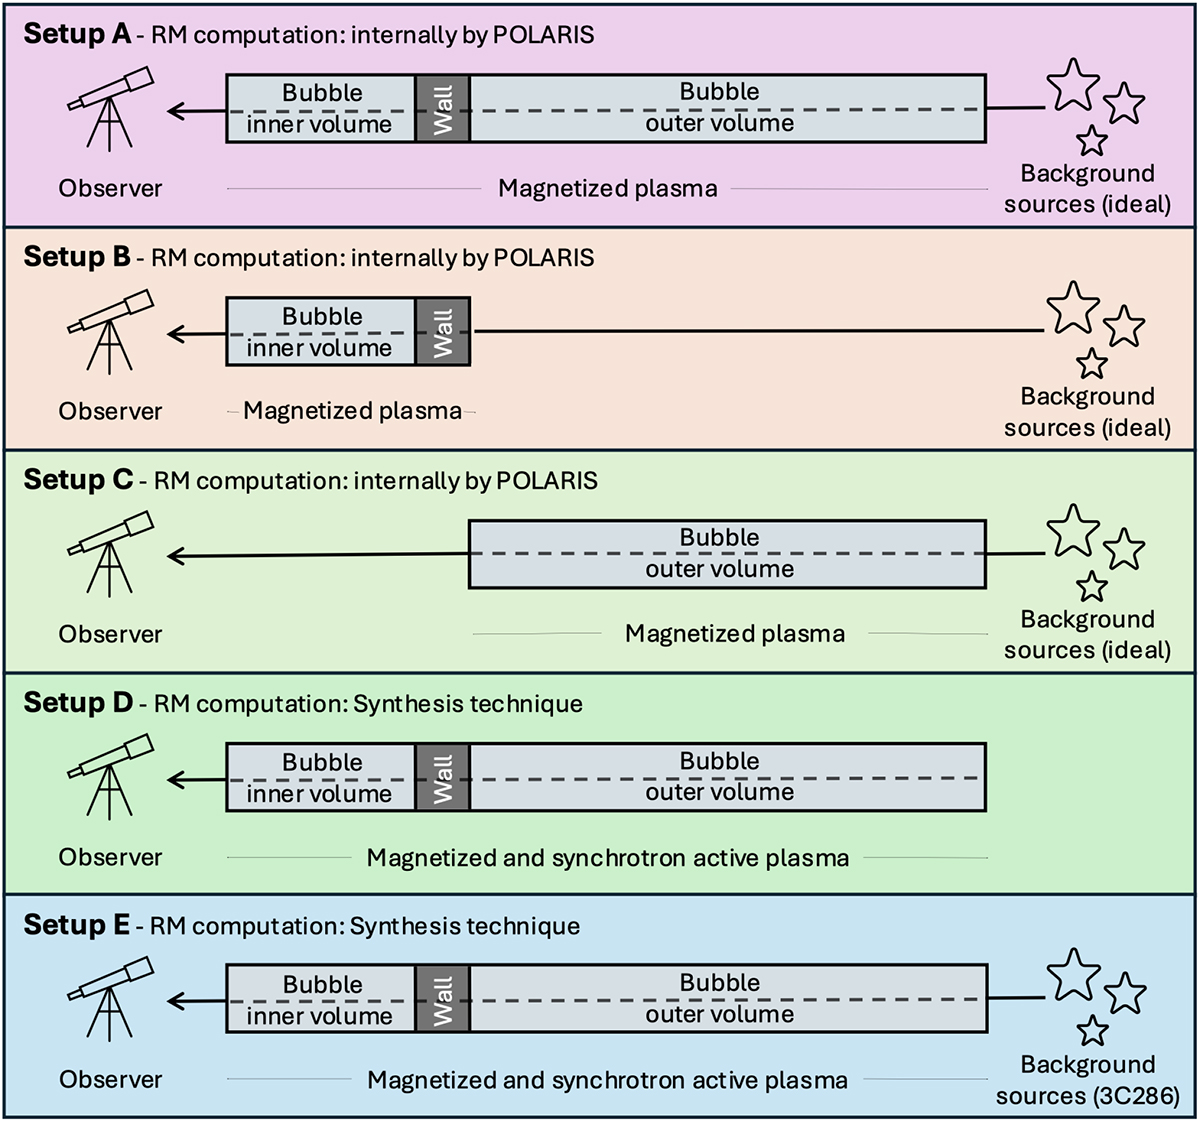
Setups for the RT simulations. This schematic representation depicts the situation along a single LOS. The method used to compute the RM is reported. The observer is positioned at the center of the cavity, marked by the yellow cross in the top panel of Fig. 1. The bubble inner volume refers to the region enclosed by the inner edge of the cavity walls, highlighted by the yellow line segments in the same figure. The wall corresponds to the gas overdensity at the bubble boundaries and is the region enclosed by the yellow and red segments in the top panel of Fig. 1. The bubble outer volume refers to the region outside the outer edge of the walls, marked by red segments. This figure is not to scale, as the specific configuration varies depending on the LOS. For a discussion of the individual schemes, we refer the reader to the text and Appendix B. Additional details about the cavity boundaries can be found in Sect. 2.1.
Current usage metrics show cumulative count of Article Views (full-text article views including HTML views, PDF and ePub downloads, according to the available data) and Abstracts Views on Vision4Press platform.
Data correspond to usage on the plateform after 2015. The current usage metrics is available 48-96 hours after online publication and is updated daily on week days.
Initial download of the metrics may take a while.