Open Access
Fig. 3.
Download original image
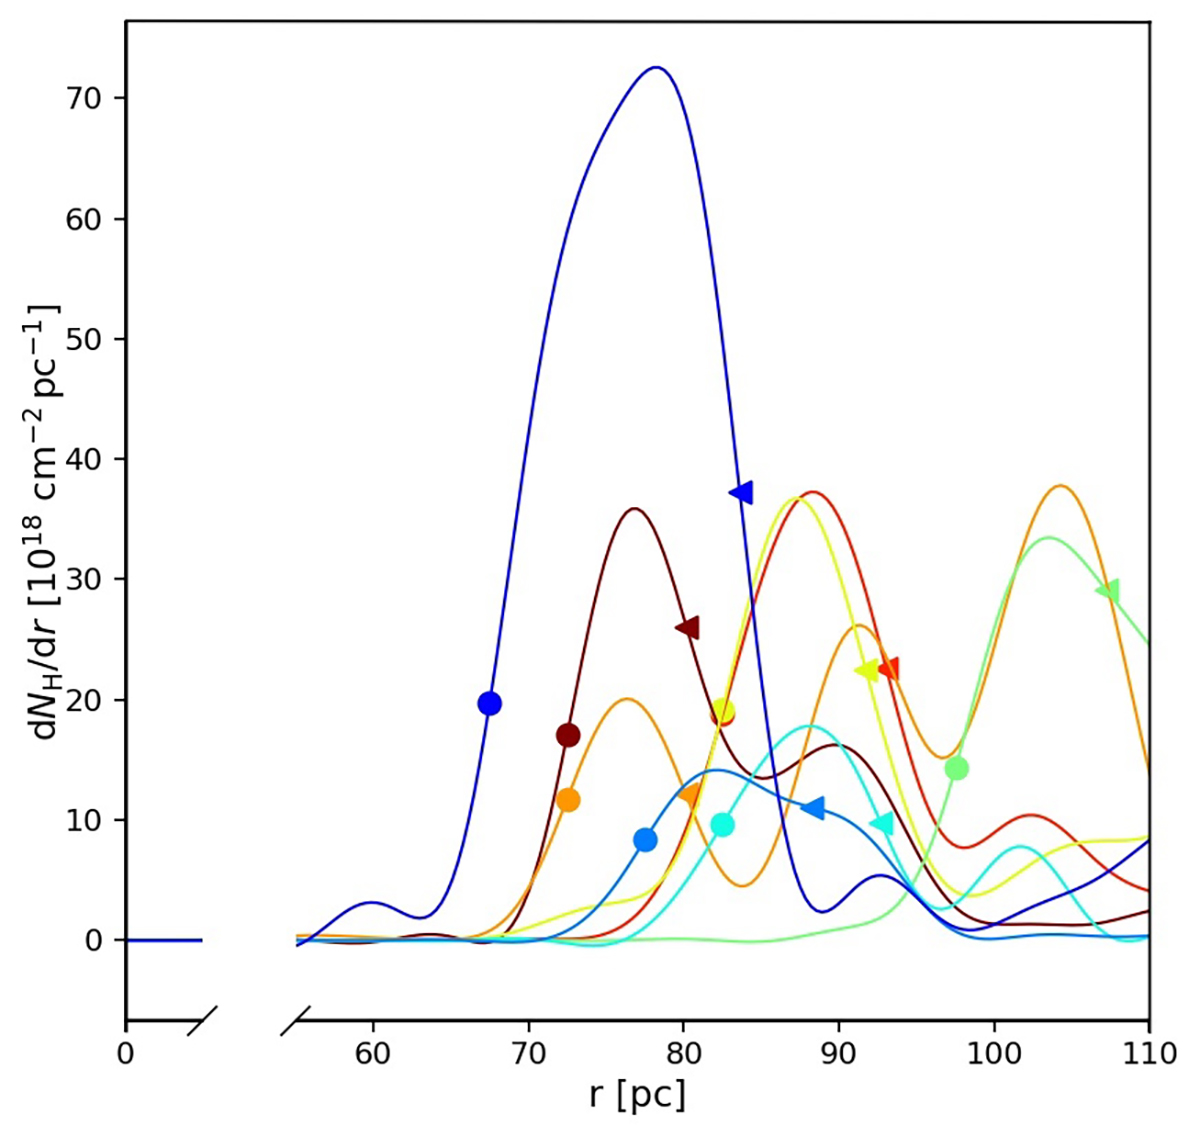
Radial profiles of the differential column density, dNH(r)/dr, for eight LOSs selected in the x − y plane. Circles and triangles represent the inner and outer boundaries of the cavity along each specific LOS, determined using the method described in Sect. 2.1. This plot is Fig. 2 in Maconi et al. (2023).
Current usage metrics show cumulative count of Article Views (full-text article views including HTML views, PDF and ePub downloads, according to the available data) and Abstracts Views on Vision4Press platform.
Data correspond to usage on the plateform after 2015. The current usage metrics is available 48-96 hours after online publication and is updated daily on week days.
Initial download of the metrics may take a while.