Open Access
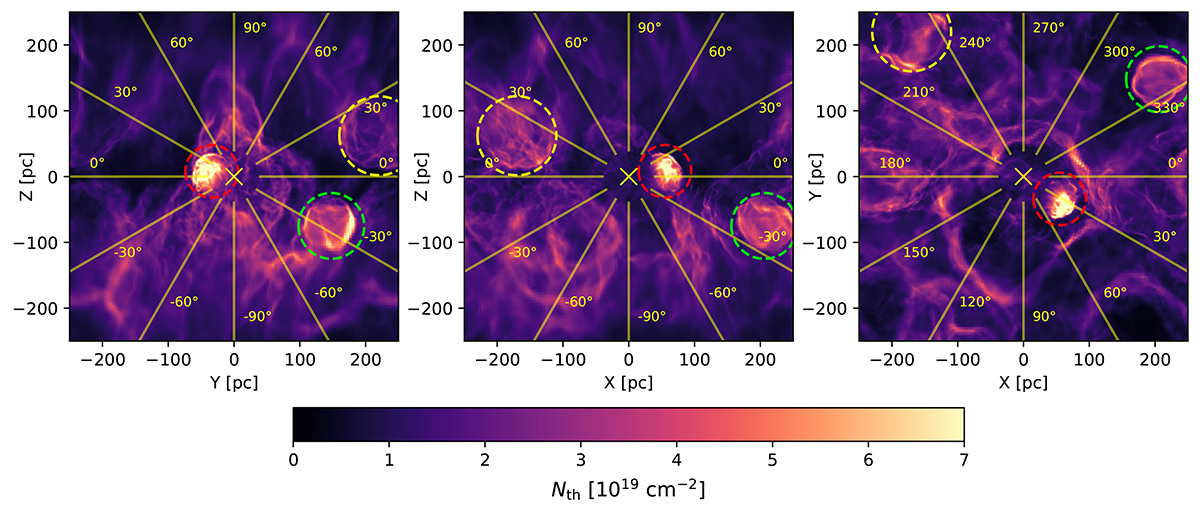
Fig. 2.
Download original image
Same as Fig. 1, but for the column density of thermal electrons. Yellow lines and angles represent the galactic coordinate system. Dashed yellow, red, and green circles indicate highly ionized bubble regions that are most prominent in the RM full-sky maps. This figure should be compared with Fig. 5.
Current usage metrics show cumulative count of Article Views (full-text article views including HTML views, PDF and ePub downloads, according to the available data) and Abstracts Views on Vision4Press platform.
Data correspond to usage on the plateform after 2015. The current usage metrics is available 48-96 hours after online publication and is updated daily on week days.
Initial download of the metrics may take a while.