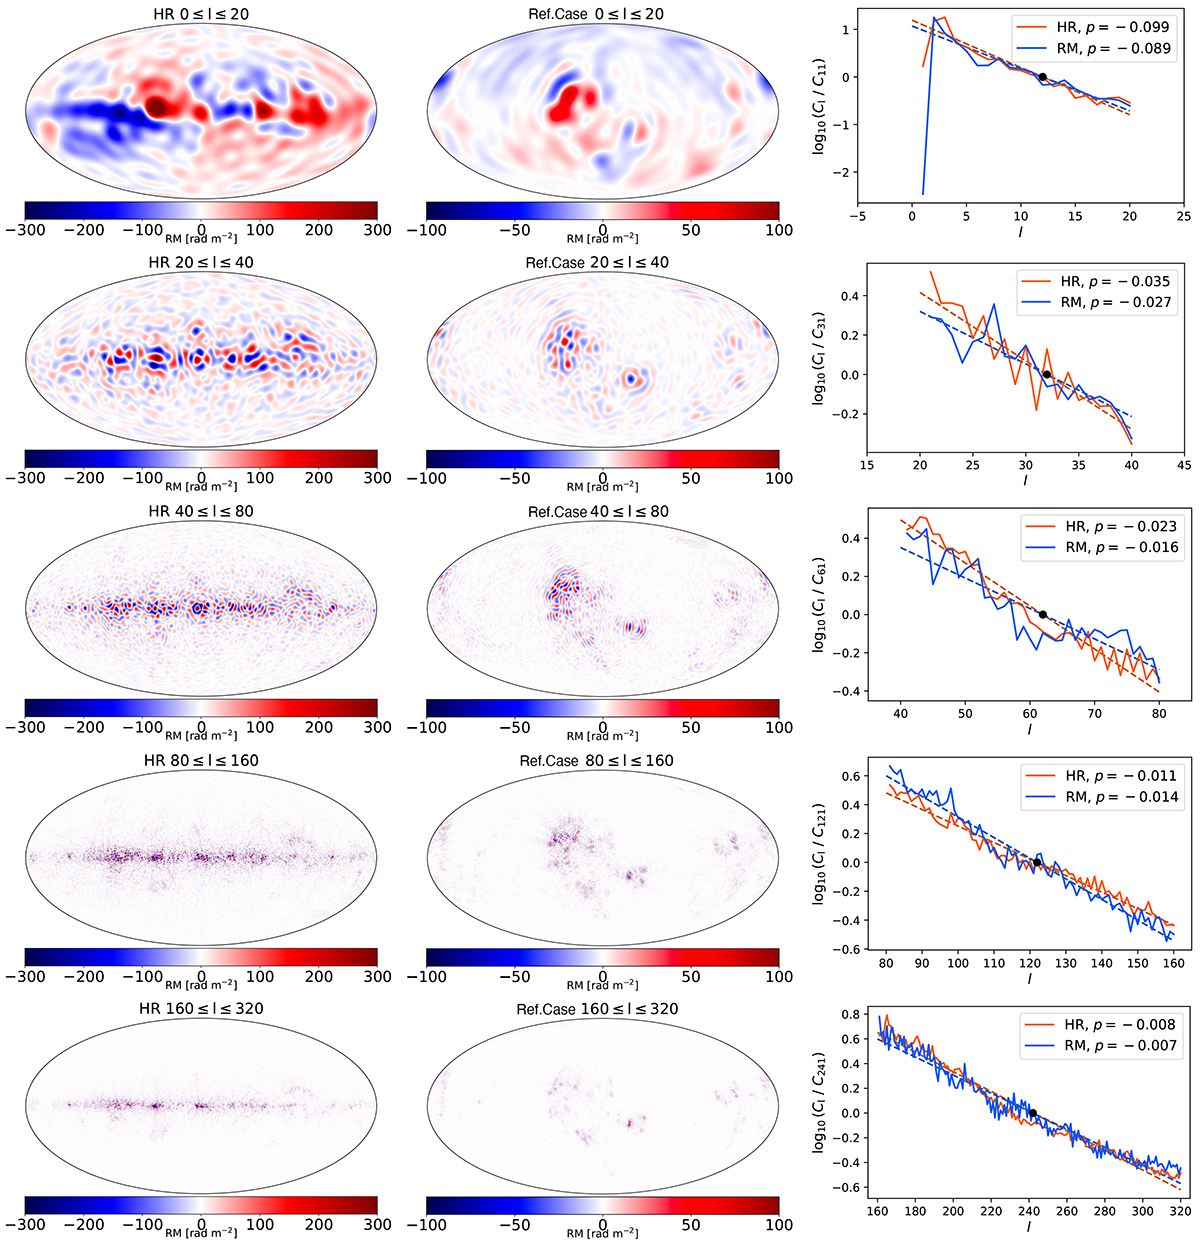
Fig. D.1.
Download original image
Harmonic multipole decomposition of the full-sky RM map presented in Hutschenreuter et al. (2022) (left), in conjunction with the simulated RM map for the reference map (center), and the corresponding power spectra of the harmonic multipole expansion (right). Each row represent a specific range of the multipole moment ℓ (ℓmin < ℓ < ℓmax). Note that the maps from Hutschenreuter et al. (2022) and the synthetic ones are not on the same scale. Hence, the resulting spectra for the map from Hutschenreuter et al. (2022) (solid orange) and the synthetic observations (solid blue) are normalized by the central value of the fitted slope with exponent p (dashed lines), for comparison. The normalization is indicated by a black dot.
Current usage metrics show cumulative count of Article Views (full-text article views including HTML views, PDF and ePub downloads, according to the available data) and Abstracts Views on Vision4Press platform.
Data correspond to usage on the plateform after 2015. The current usage metrics is available 48-96 hours after online publication and is updated daily on week days.
Initial download of the metrics may take a while.