Fig. 10.
Download original image
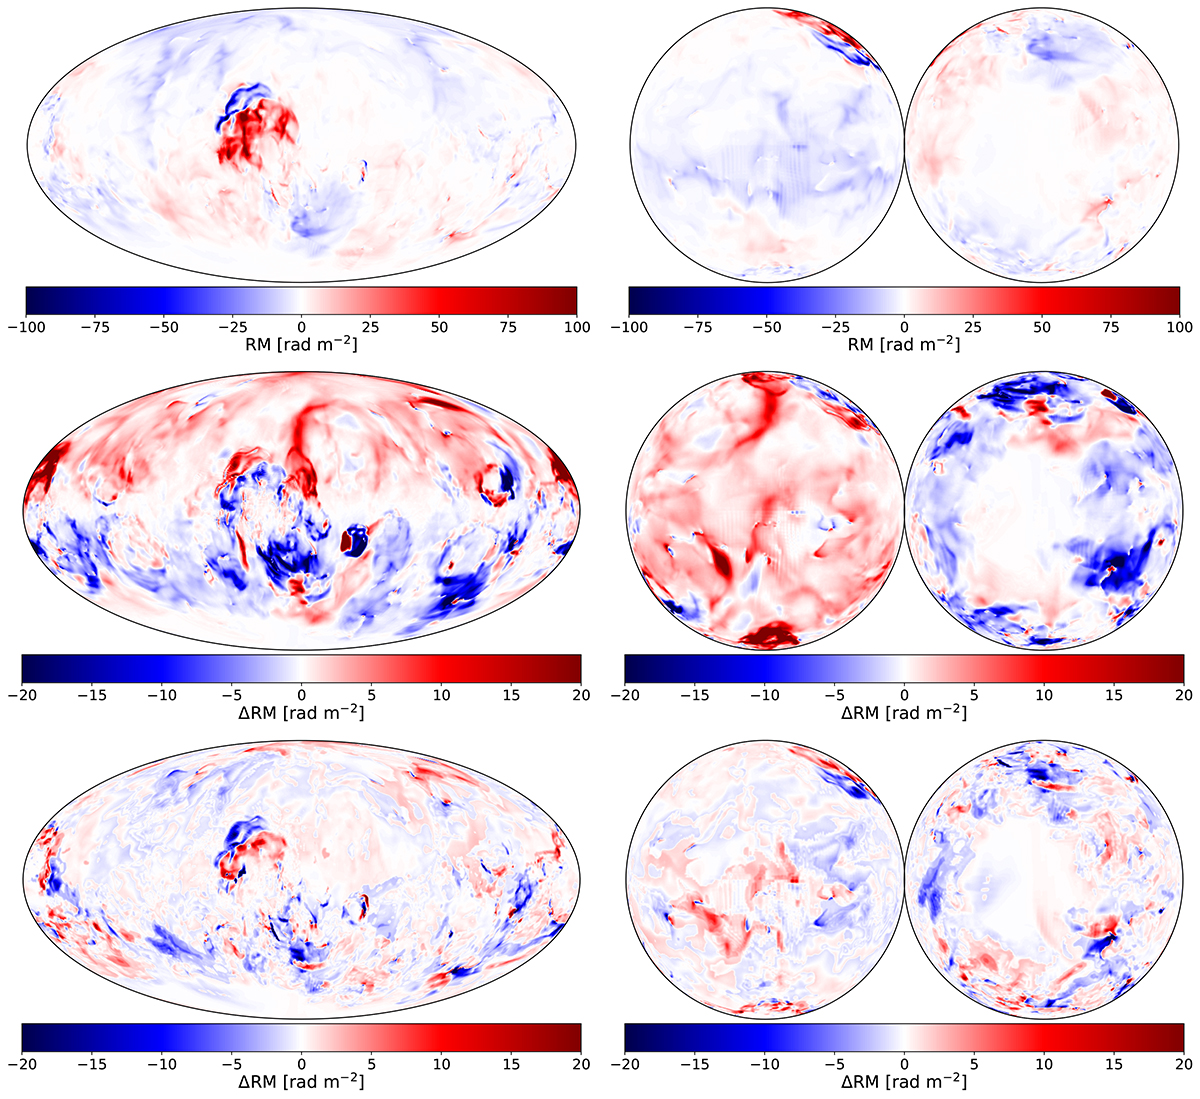
Top panel: Same as in Fig. 5, but for the RM signal obtained from synchrotron radiation without any background source (setup D). Middle panel: Difference between the RM reference map (see Fig. 5) and the one presented in the top panel of this figure. Bottom panel: Difference between the RM map obtained by considering only the volume enclosed by the bubble walls (see Fig. 9) and the one presented in the top panel of this figure.
Current usage metrics show cumulative count of Article Views (full-text article views including HTML views, PDF and ePub downloads, according to the available data) and Abstracts Views on Vision4Press platform.
Data correspond to usage on the plateform after 2015. The current usage metrics is available 48-96 hours after online publication and is updated daily on week days.
Initial download of the metrics may take a while.