Fig. 2.
Download original image
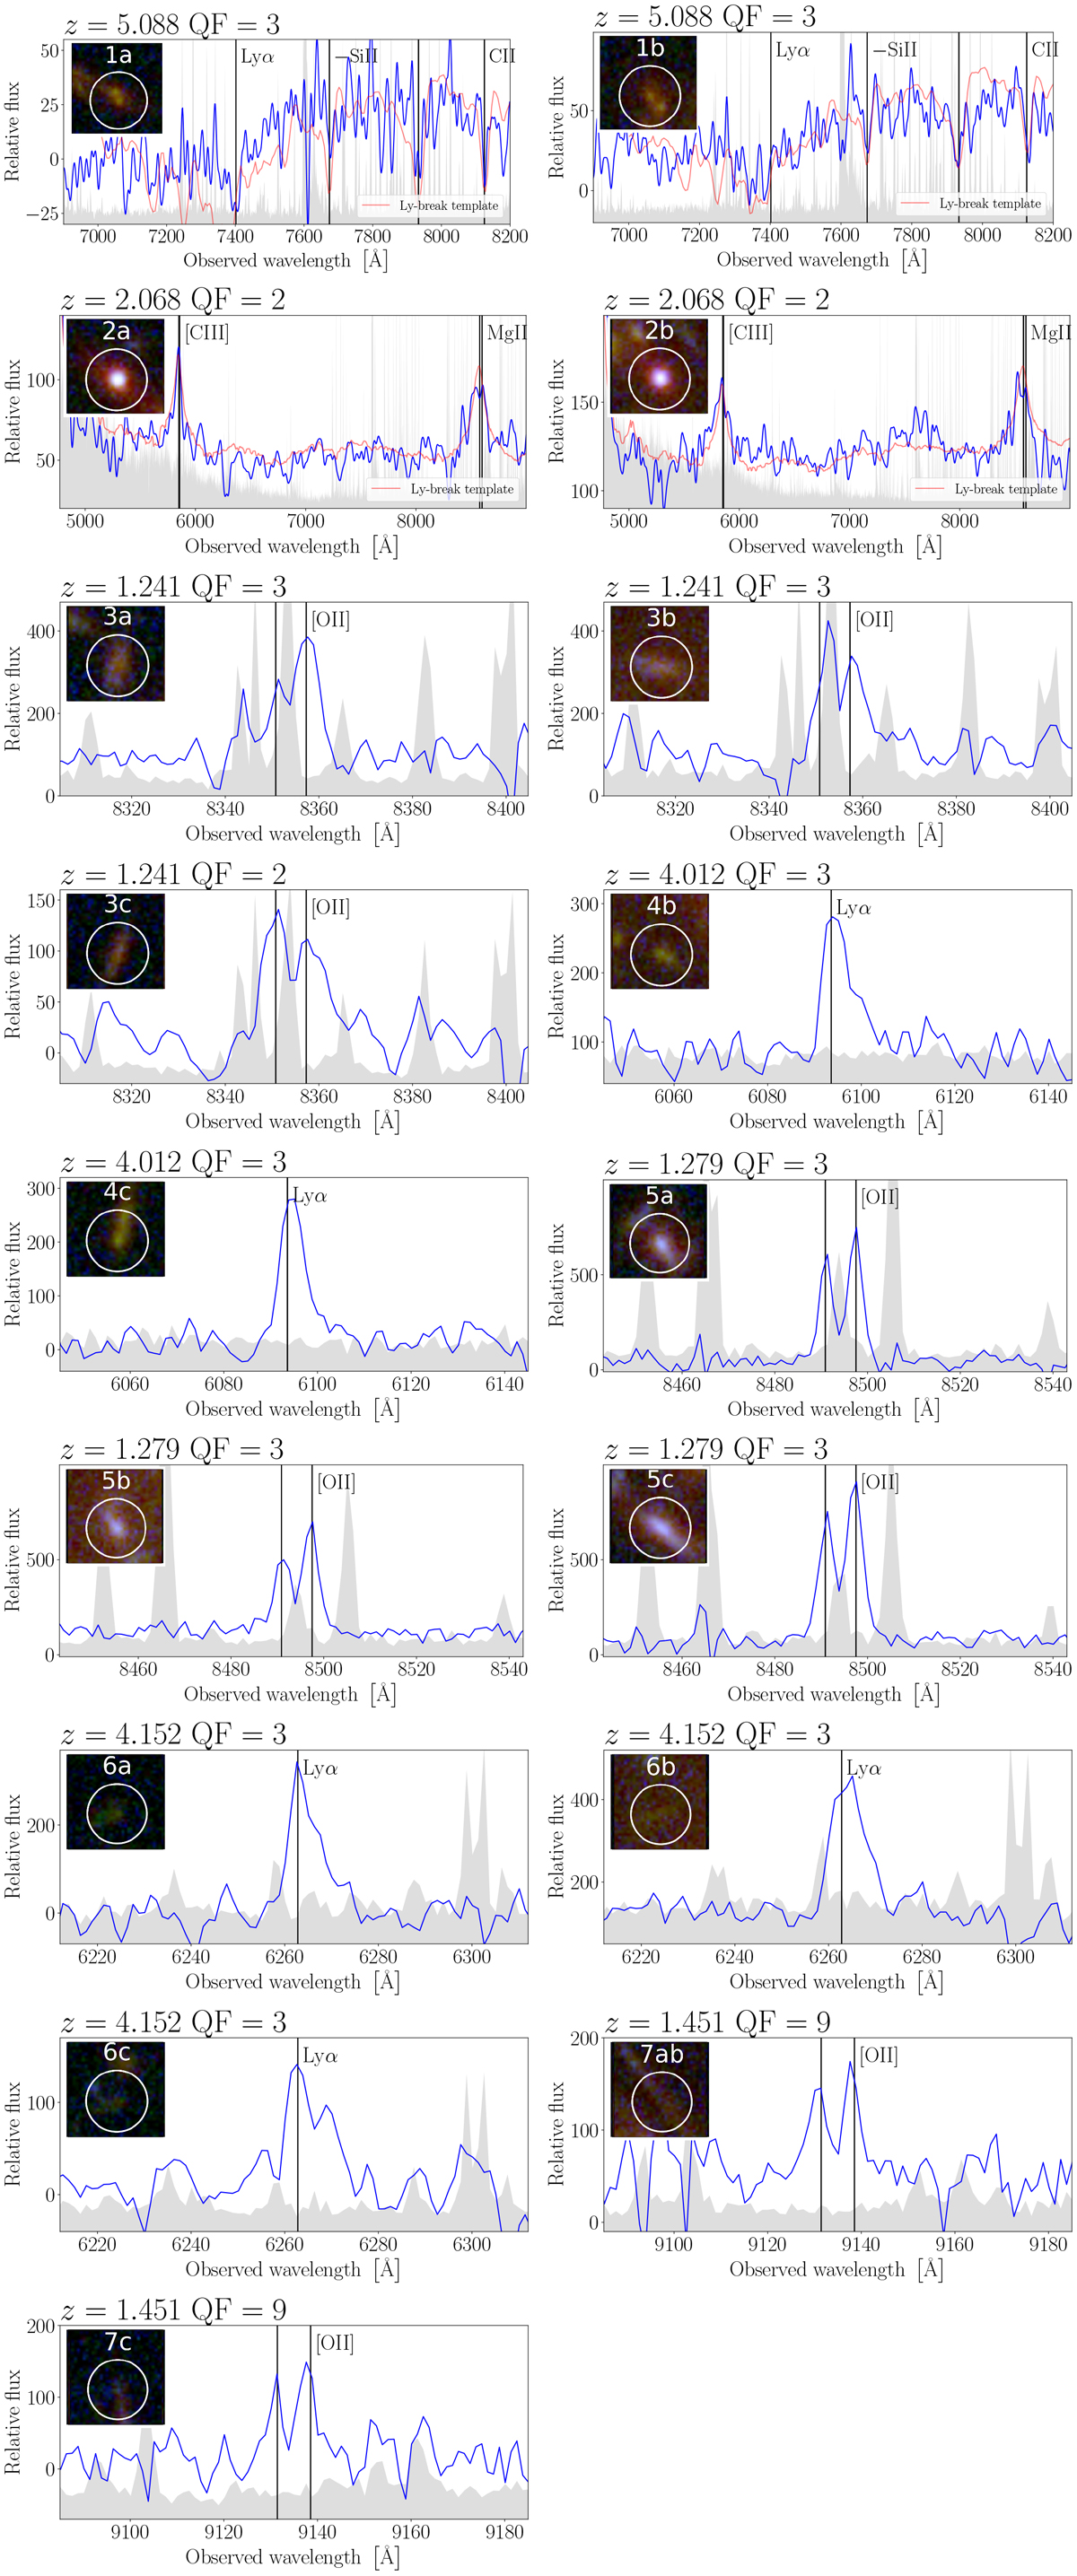
Spectra of multiply lensed sources. Blue lines indicate the spectroscopic data and gray regions of variance. Vertical lines show the main spectral features present in each wavelength range. In cases where the continuum is clearly detected, the red line corresponds to the template used to estimate the exact redshift. The small HST cutouts in the top-left region of each panel are 2 arcsec per side.
Current usage metrics show cumulative count of Article Views (full-text article views including HTML views, PDF and ePub downloads, according to the available data) and Abstracts Views on Vision4Press platform.
Data correspond to usage on the plateform after 2015. The current usage metrics is available 48-96 hours after online publication and is updated daily on week days.
Initial download of the metrics may take a while.