Fig. 8
Download original image
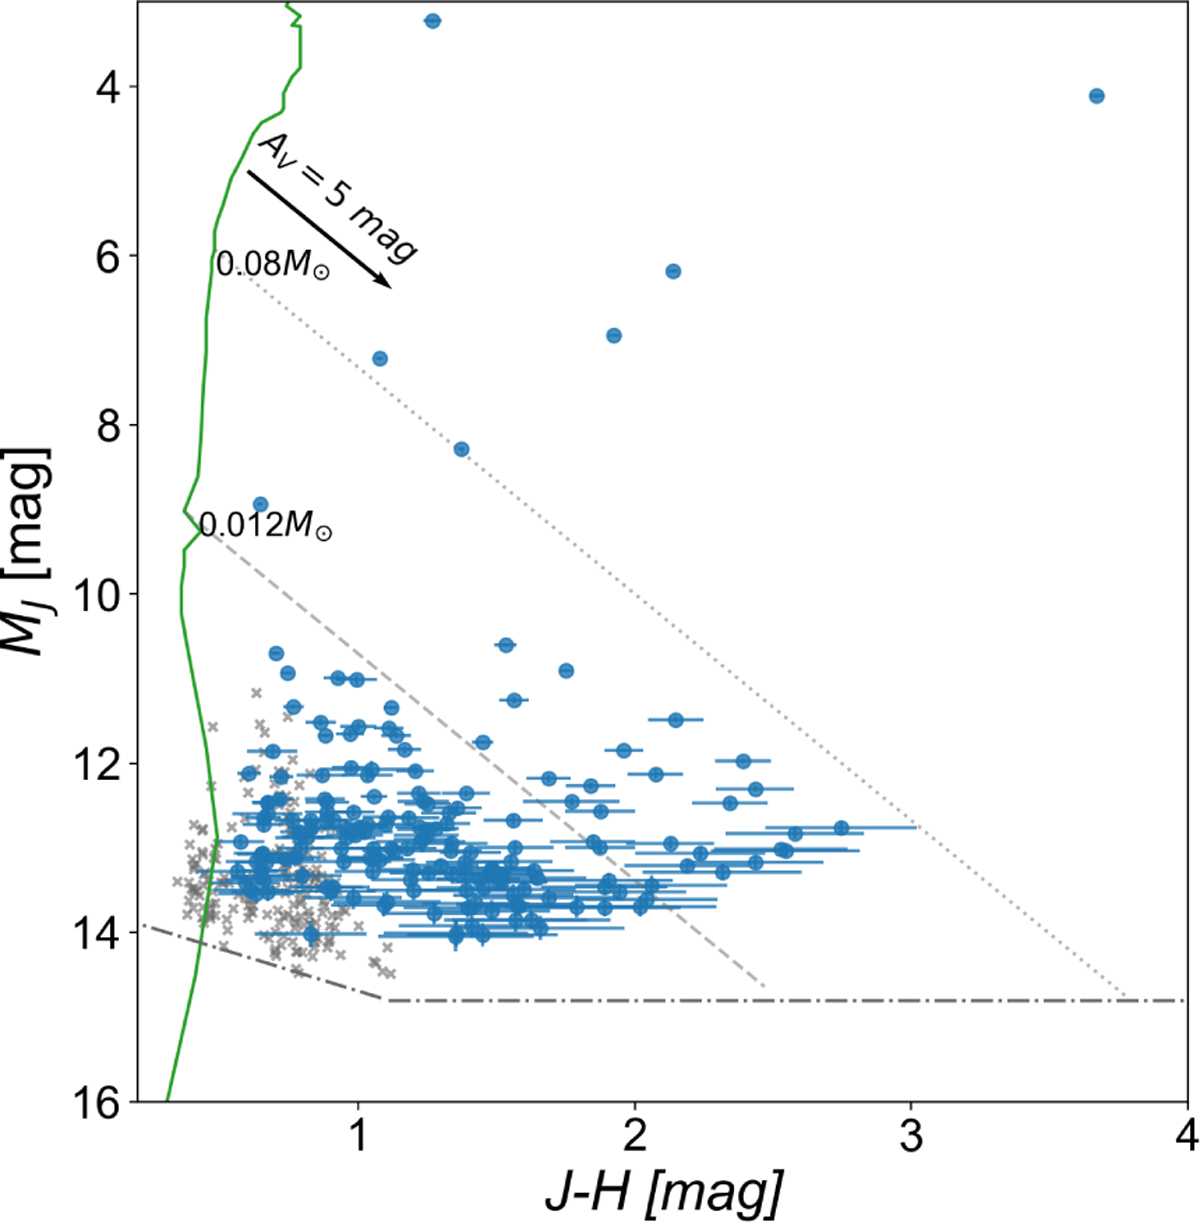
Absolute J/[J – H] color-magnitude diagram of our identified Class II candidates in the R CrA region (blue circle) and the NIR-excess sources in the reference field (grey crosses). The green solid line and black arrow show the 1 Myr isochrone (Baraffe et al. 2015) and reddening vector of AV = 5 mag, respectively. The grey dotted and dash-dotted lines are the reddening lines of the LMS/BD and BD/PMO boundaries, respectively, and the gray dashed lines indicate the completeness limit. The brightest candidates, T CrA and S CrA, are not shown in this figure for better visibility.
Current usage metrics show cumulative count of Article Views (full-text article views including HTML views, PDF and ePub downloads, according to the available data) and Abstracts Views on Vision4Press platform.
Data correspond to usage on the plateform after 2015. The current usage metrics is available 48-96 hours after online publication and is updated daily on week days.
Initial download of the metrics may take a while.