Fig. 6
Download original image
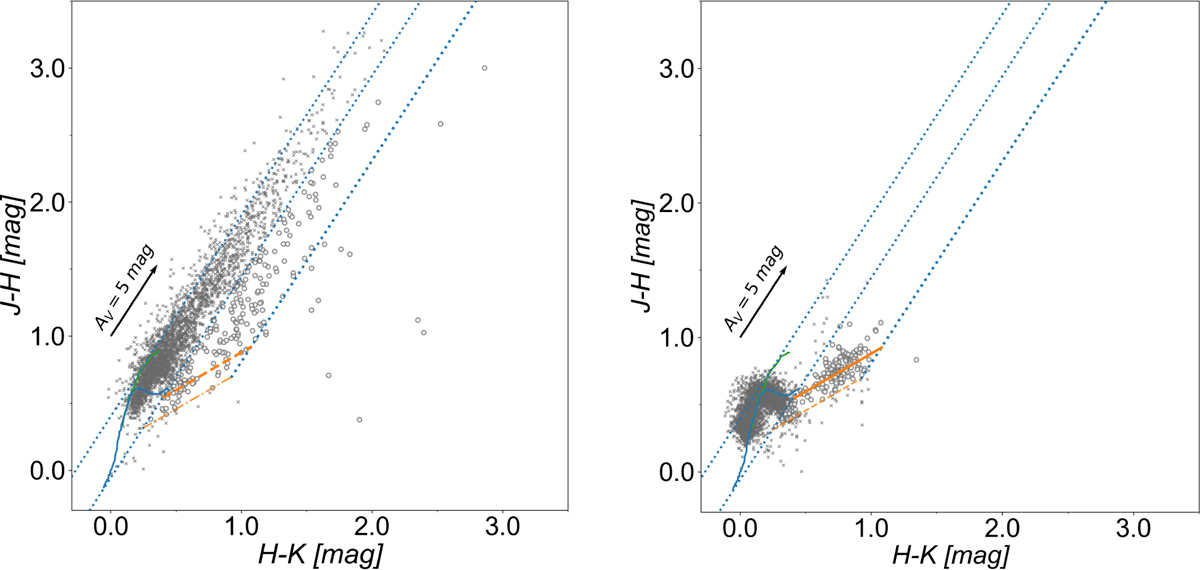
Left: [J – H]/[H – K] color-color diagram of 2922 objects observed with S/N>10 at the K-band in the R CrA region. Circles and crosses show the objects identified as YSO candidates and background stars. Orange dashed lines show the intrinsic locus of CTTS, and blue solid and green solid lines show the intrinsic colors of main sequence stars and giants, respectively. An orange dash-dotted line shows the line that includes the 10σ color errors and reddening from the CTTS locus. Blue dotted lines represent the boundary of Class I and II, reddening vectors of main sequence stars and giant stars, from right to left. The black arrow shows the reddening vector of Av = 5. Right: [J – H]/[H – K] color-color diagram of the reference field. Lines and markers are the same as the color-color diagram of the R CrA region. The black arrow shows the reddening vector of Av = 5.
Current usage metrics show cumulative count of Article Views (full-text article views including HTML views, PDF and ePub downloads, according to the available data) and Abstracts Views on Vision4Press platform.
Data correspond to usage on the plateform after 2015. The current usage metrics is available 48-96 hours after online publication and is updated daily on week days.
Initial download of the metrics may take a while.