Fig. A.1
Download original image
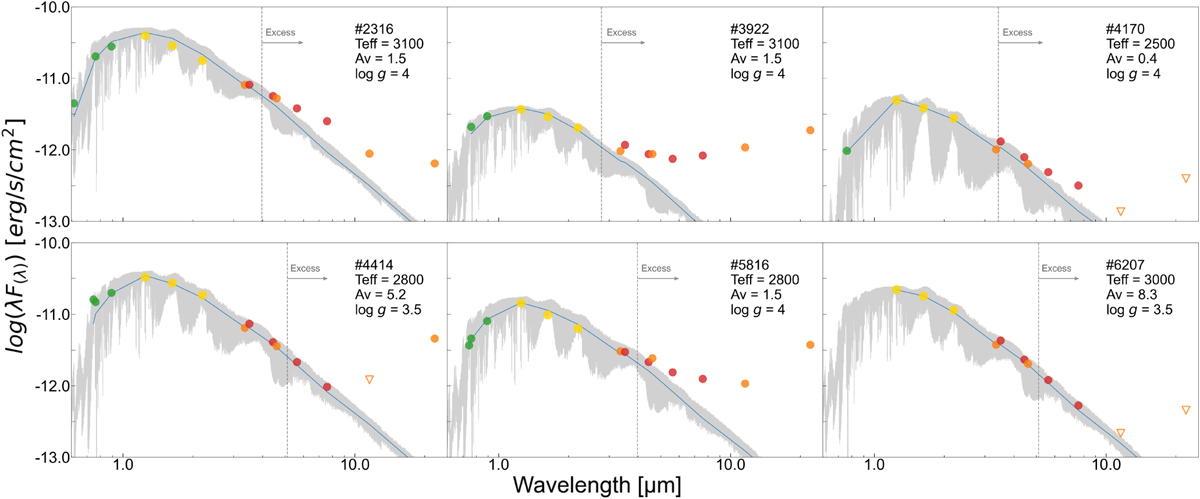
Derived SEDs of our BD and PMO candidates. Green, yellow, orange, and red circles represent optical (SDSS and/or Gaia), our JHK photometry, unWISE(Schlafly et al. 2019), and Spitzer data. Open triangles in the figure show that the AllWISE upper limit. Error bars are smaller than the symbol size. Blue and gray solid line shows the best fitted flux and spectrum of the BT-Settl model (Caffau et al. 2011). The source ID and the derived parameters are shown in the upper right of figures. The TSED was determined from the fluxes in the wavelength shorter than the vertical dashed line.
Current usage metrics show cumulative count of Article Views (full-text article views including HTML views, PDF and ePub downloads, according to the available data) and Abstracts Views on Vision4Press platform.
Data correspond to usage on the plateform after 2015. The current usage metrics is available 48-96 hours after online publication and is updated daily on week days.
Initial download of the metrics may take a while.