Fig. 12
Download original image
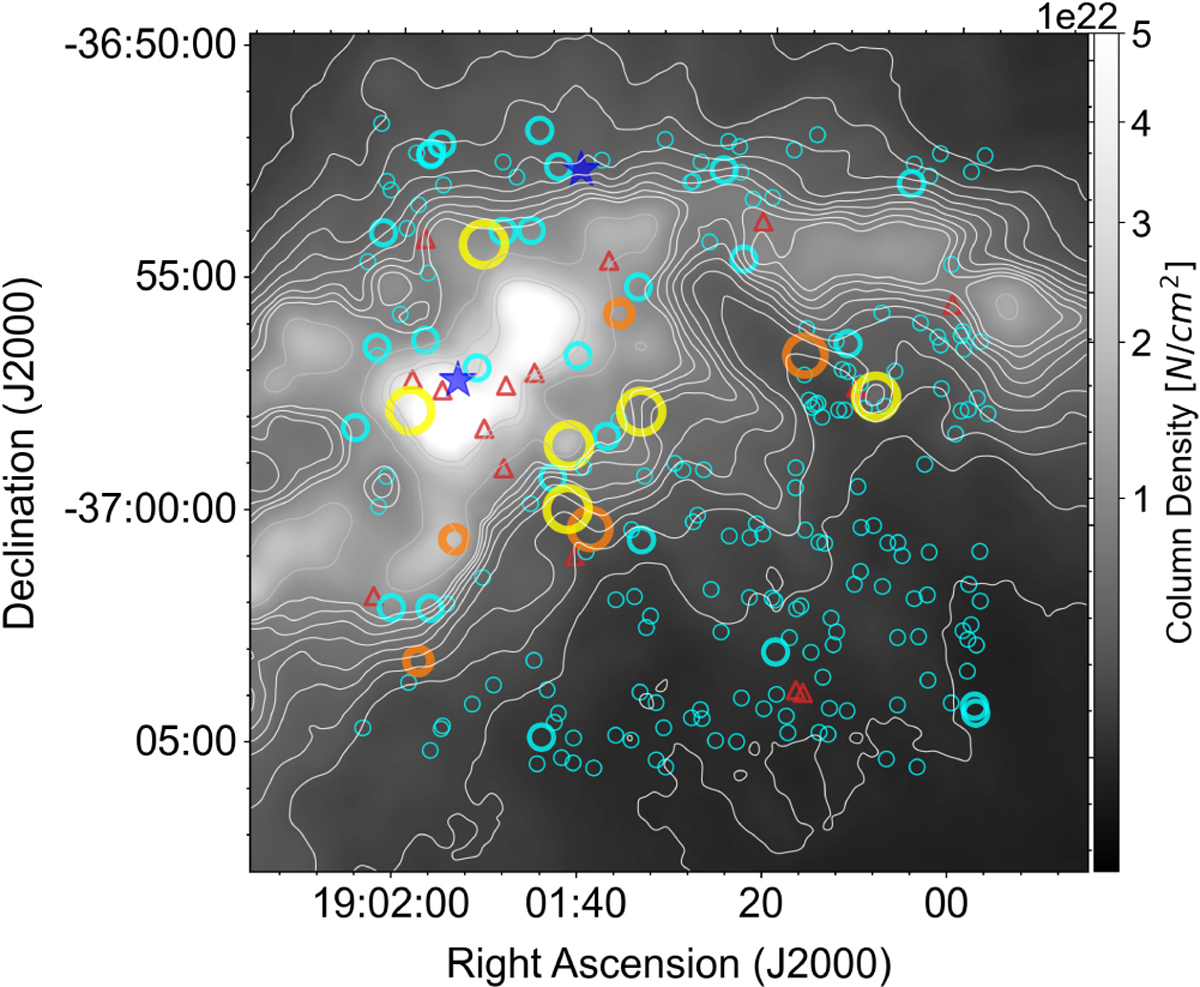
Spatial distribution of the identified YSO candidates in the R CrA region. Yellow, orange, cyan and red circles represent identified LMS, BD, PMO, and Class I candidates, respectively. Objects with their luminosity below the completeness limit are shown as small cyan circles. Blue star symbols show positions of young early-type stars named R CrA and TY CrA that are not among our YSO candidates. Solid contours show the Herschel dust column density distribution where 1, 2, 3, 4, 5, 6, 7, 8, 9, 10, 15, 20, 25, 30, 35, 40, 45, 50 × 1021/cm2.
Current usage metrics show cumulative count of Article Views (full-text article views including HTML views, PDF and ePub downloads, according to the available data) and Abstracts Views on Vision4Press platform.
Data correspond to usage on the plateform after 2015. The current usage metrics is available 48-96 hours after online publication and is updated daily on week days.
Initial download of the metrics may take a while.