Fig. 10
Download original image
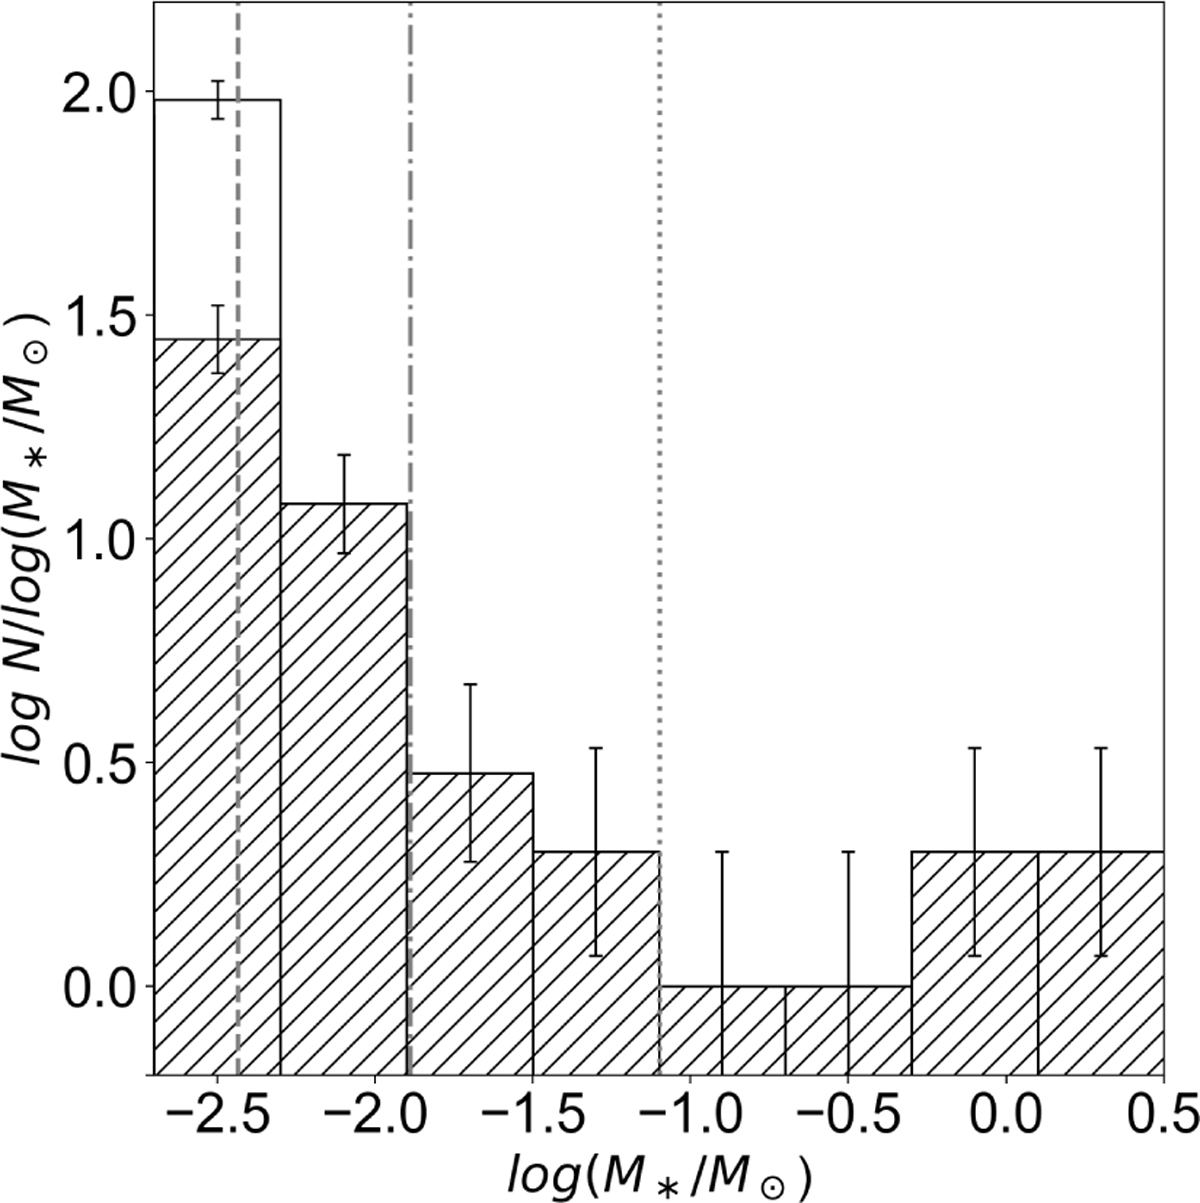
Derived 1 Myr IMF in the R CrA region. Error bars represent the Poisson errors for each bin. Vertical dotted, dash-dotted, and dashed lines show the LMS/BD, BD/PMO boundaries and the completeness limit, respectively. The open histogram shows the IMF of all the sources, while the hatched histogram shows the IMF after subtracting the contaminated MF.
Current usage metrics show cumulative count of Article Views (full-text article views including HTML views, PDF and ePub downloads, according to the available data) and Abstracts Views on Vision4Press platform.
Data correspond to usage on the plateform after 2015. The current usage metrics is available 48-96 hours after online publication and is updated daily on week days.
Initial download of the metrics may take a while.