Fig. 4.
Download original image
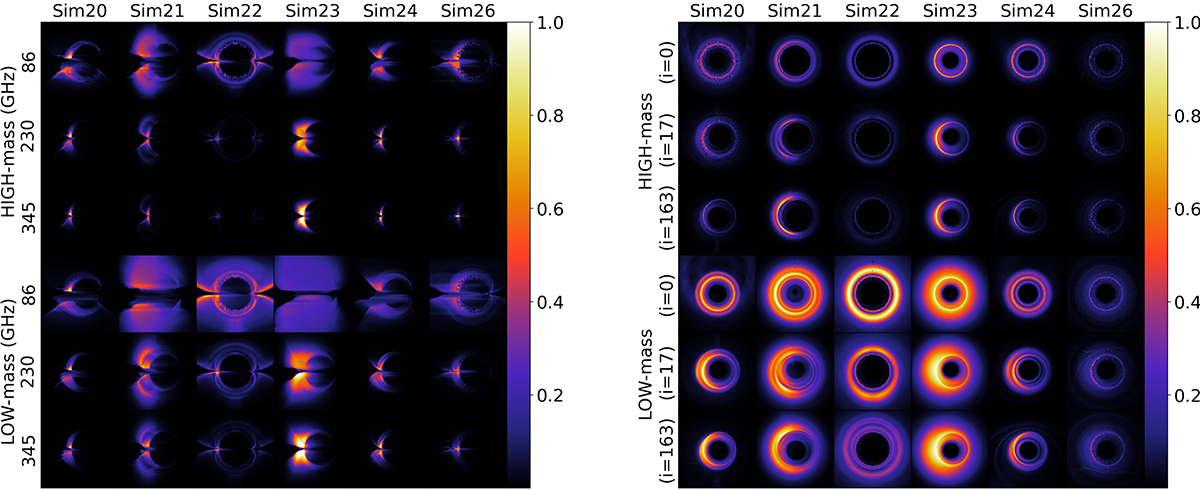
Left: Normalized emission maps (25 Rg across) for an edge-on view for all our simulations applied for HIGH-mass (upper 3 rows) and LOW-mass (lower 3 rows) systems at 86 GHz, 230 GHz and 345 GHz obtained with the Eddington ratio detailed in Table 1. Right: Normalized 230 GHz emission maps (25 Rg across) as above but for inclination angles of 0°, 17°, and 163°.
Current usage metrics show cumulative count of Article Views (full-text article views including HTML views, PDF and ePub downloads, according to the available data) and Abstracts Views on Vision4Press platform.
Data correspond to usage on the plateform after 2015. The current usage metrics is available 48-96 hours after online publication and is updated daily on week days.
Initial download of the metrics may take a while.