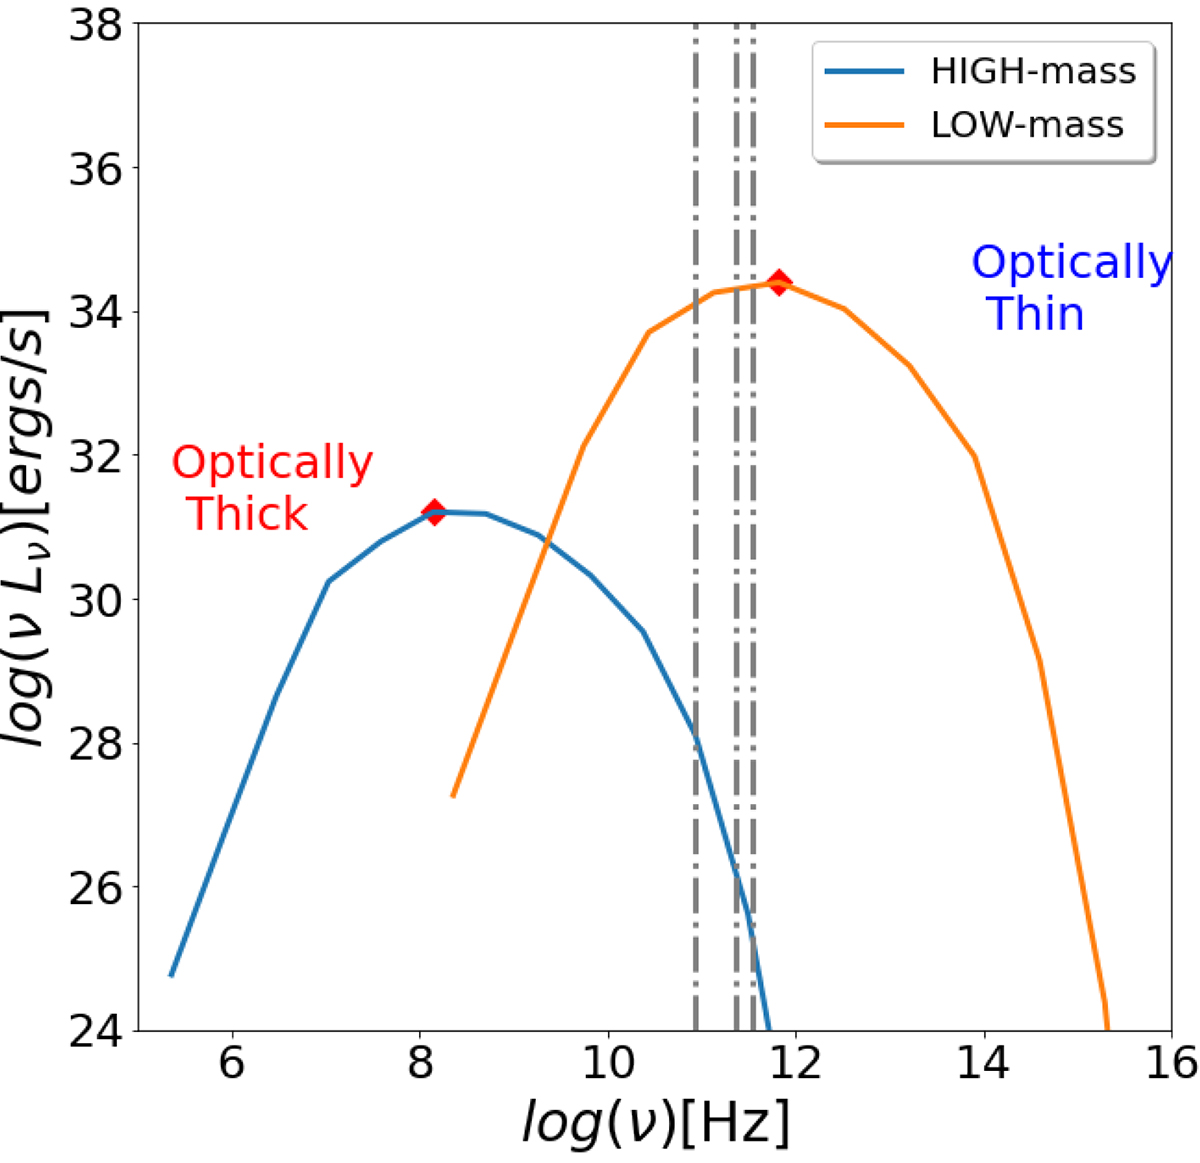
Fig. 3.
Download original image
SEDs for simulations with black hole masses similar to M87 (blue curves, HIGH-mass) and SgrA* (orange curves, LOW-mass) for SIM20 with the same accretion rate. The three vertical lines correspond to 86 GHz, 230 GHz, and 345 GHz, respectively. The figure also marks the optically thin and optically thicker regions of the thermal synchrotron which lie on the right and left sides of the thermal synchrotron peak marked by the red diamond.
Current usage metrics show cumulative count of Article Views (full-text article views including HTML views, PDF and ePub downloads, according to the available data) and Abstracts Views on Vision4Press platform.
Data correspond to usage on the plateform after 2015. The current usage metrics is available 48-96 hours after online publication and is updated daily on week days.
Initial download of the metrics may take a while.