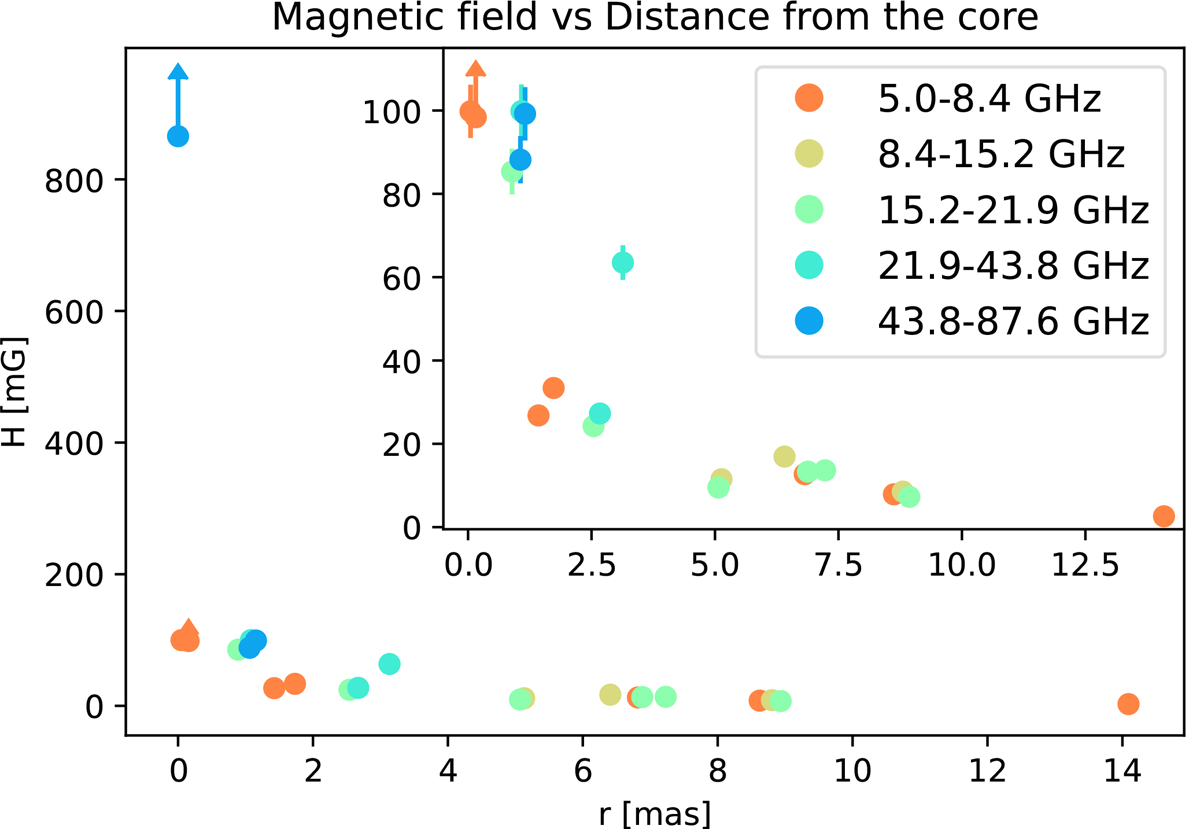
Fig. 6.
Download original image
Equipartition magnetic field, Heq, in mG vs. the distance from the core component, r, in mas. The error bars represent the uncertainties, and the arrows represent the upper or lower limits. The various colors represent the different pairs of frequencies at which each component has been matched (Sect. 4.2), as can be seen from the legend. The inset represents a zoomed-in version of the plot.
Current usage metrics show cumulative count of Article Views (full-text article views including HTML views, PDF and ePub downloads, according to the available data) and Abstracts Views on Vision4Press platform.
Data correspond to usage on the plateform after 2015. The current usage metrics is available 48-96 hours after online publication and is updated daily on week days.
Initial download of the metrics may take a while.