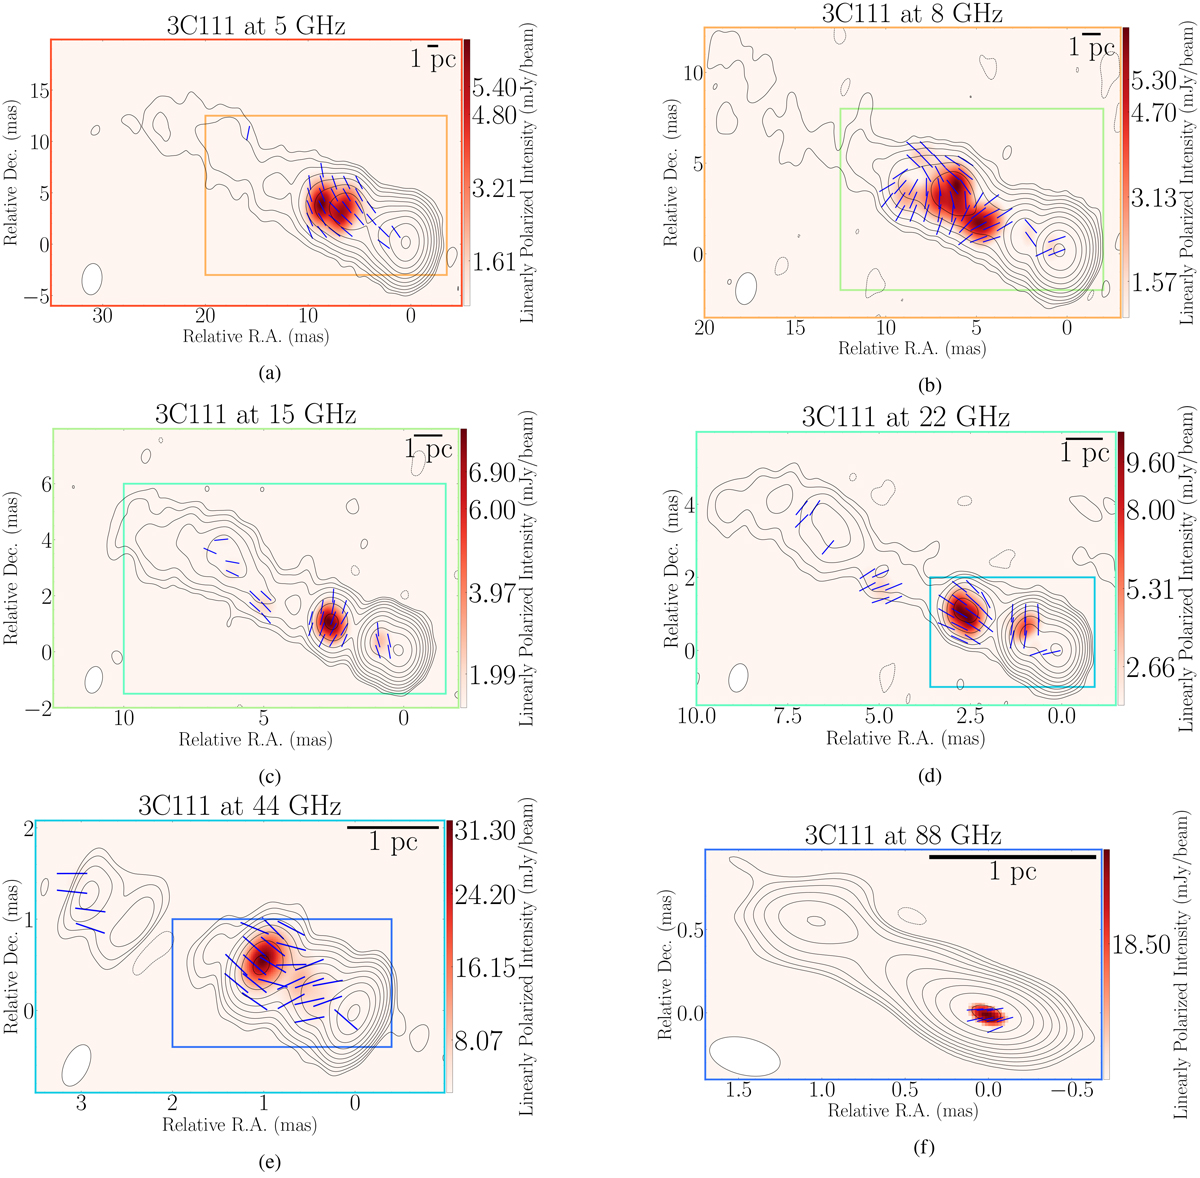
Fig. 5.
Download original image
Linear polarization intensity images of 3C 111 for the May 8, 2014, observation, plotted over the respective total intensity contours (Fig. 1). In each panel we plot the restoring beam as a white ellipse in the bottom left corner and a size scale reference of 1 pc in the top right corner. The blue bars represent the EVPAs. Starting from Fig. 5a, in each image, there is a colored box representing the size of the following frequency image. The frequencies are color-coded from the lowest (5GHz) to the highest (87.6 GHz), going from red to blue. All the information for each map can be found in Table 3.
Current usage metrics show cumulative count of Article Views (full-text article views including HTML views, PDF and ePub downloads, according to the available data) and Abstracts Views on Vision4Press platform.
Data correspond to usage on the plateform after 2015. The current usage metrics is available 48-96 hours after online publication and is updated daily on week days.
Initial download of the metrics may take a while.