Fig. 4.
Download original image
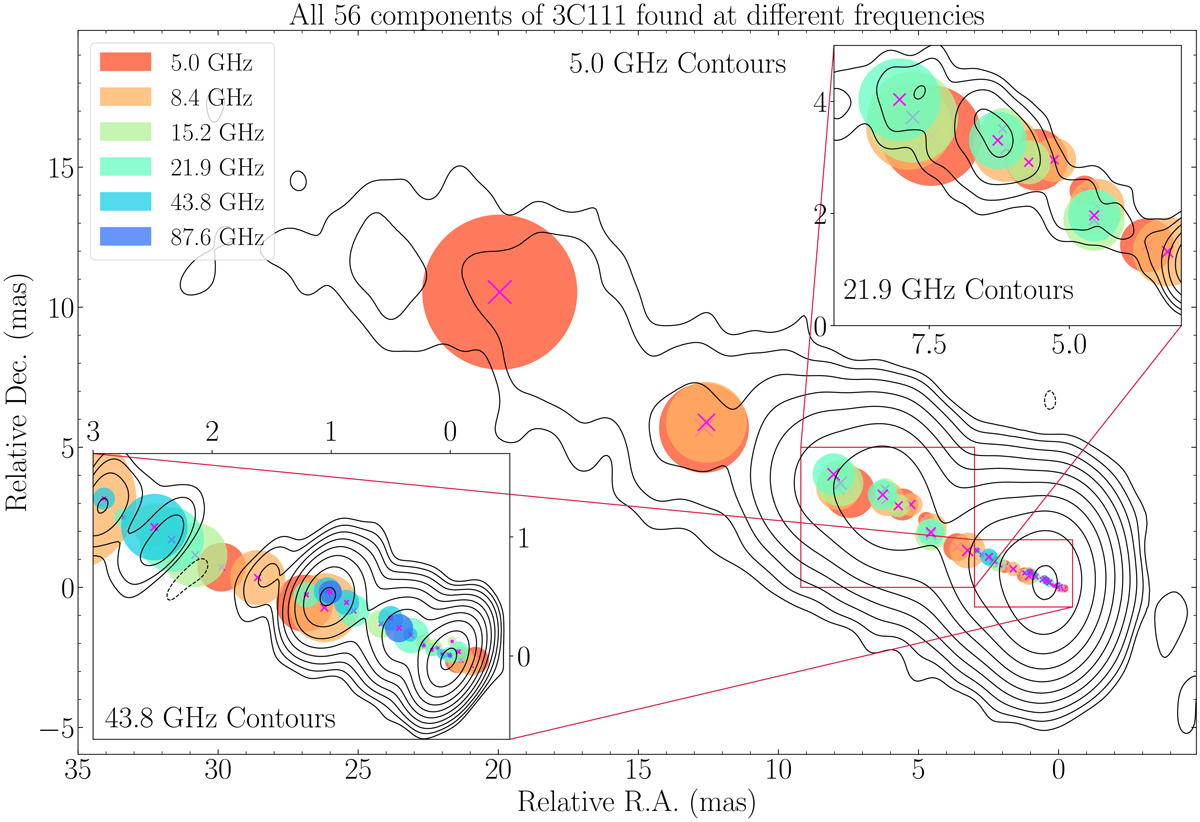
All the modelfit components found in 3C 111, plotted over the 5 GHz contours (Fig. 1a). The components at each frequency are represented by the color in the legend, and their position is corrected for the core shift found in Sect. 3.2. The upper right panel shows the region between 9 and 2 mas in right ascension (RA) and 0 and 5 in declination (Dec). The contours are of the 21.9 GHz maps (Fig. 1d). The lower left panel shows the region between −0.5 and 3 mas in RA and −0.7 and 1.7 in Dec. The contours are of the 43.8 GHz map (Fig. 1e).
Current usage metrics show cumulative count of Article Views (full-text article views including HTML views, PDF and ePub downloads, according to the available data) and Abstracts Views on Vision4Press platform.
Data correspond to usage on the plateform after 2015. The current usage metrics is available 48-96 hours after online publication and is updated daily on week days.
Initial download of the metrics may take a while.