Fig. 3.
Download original image
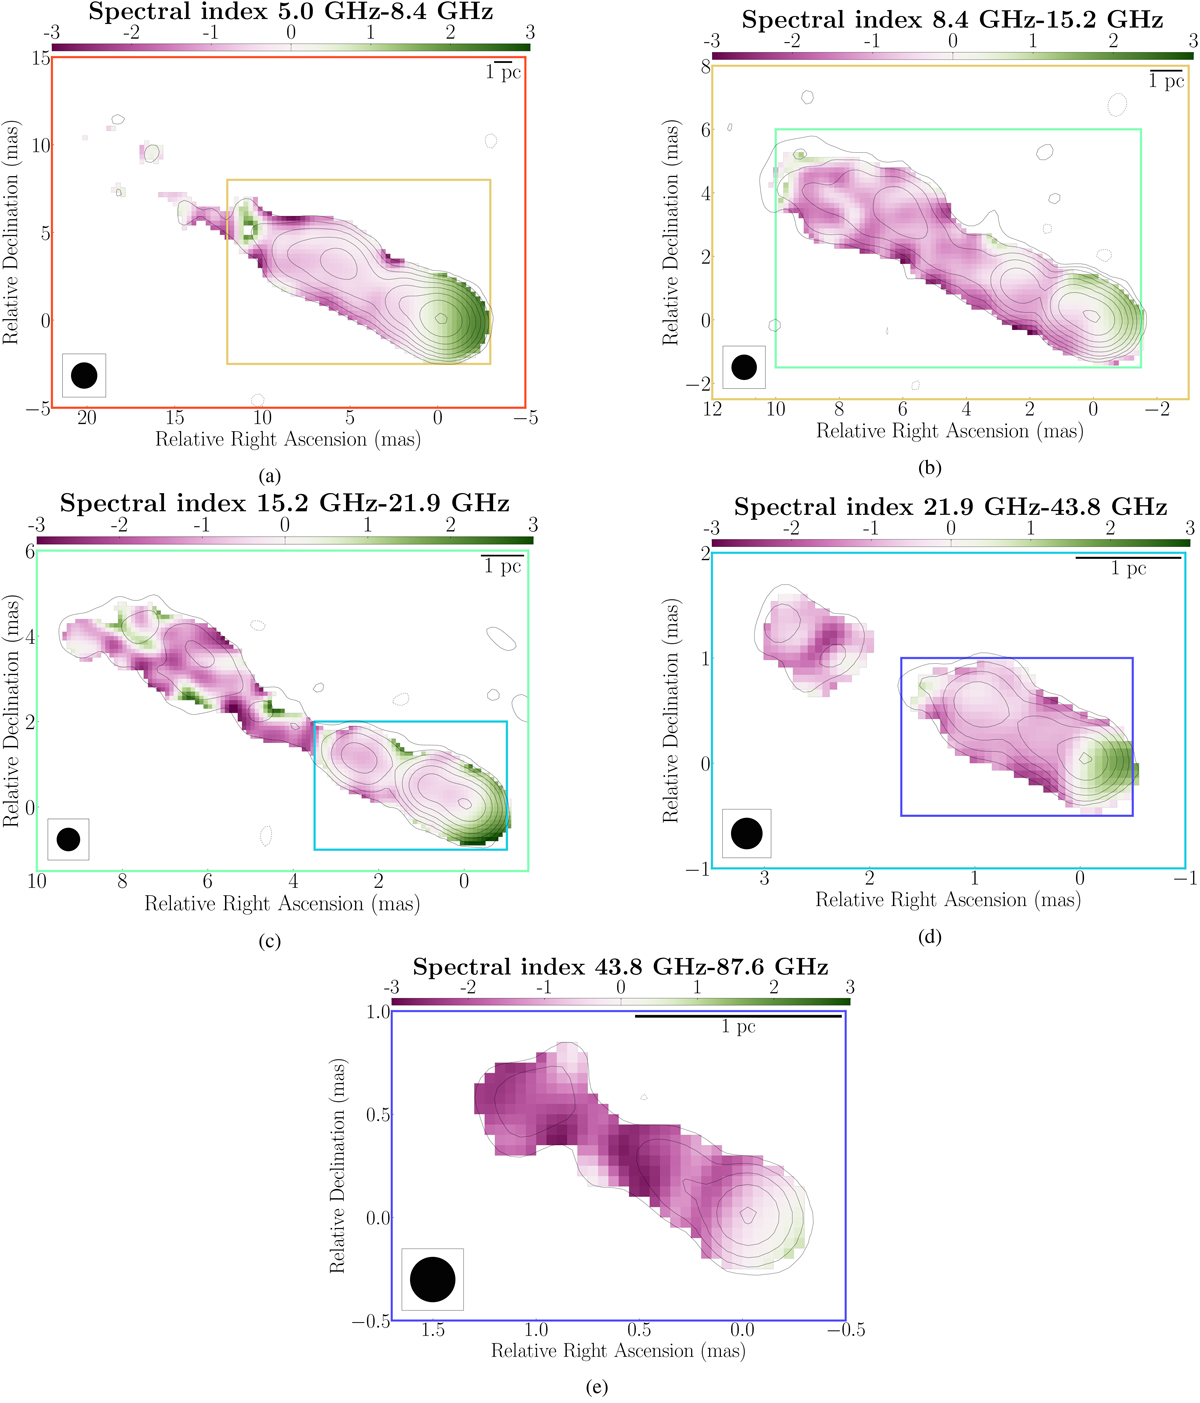
Spectral index maps for all five frequency pairs, computed following Sect. 3.3, plotted over the higher-frequency contours. In each panel, the common beam for the two frequencies is plotted as a black circle in the bottom left corner, and a size scale reference of 1 pc is in the top right corner. The frequency pairs are color-coded from the lowest (5 − 8.4 GHz) to the highest (43.8 − 87.6 GHz), going from red to blue. The color map is chosen from a colour-vision deficiency-friendly package (Crameri 2023).
Current usage metrics show cumulative count of Article Views (full-text article views including HTML views, PDF and ePub downloads, according to the available data) and Abstracts Views on Vision4Press platform.
Data correspond to usage on the plateform after 2015. The current usage metrics is available 48-96 hours after online publication and is updated daily on week days.
Initial download of the metrics may take a while.