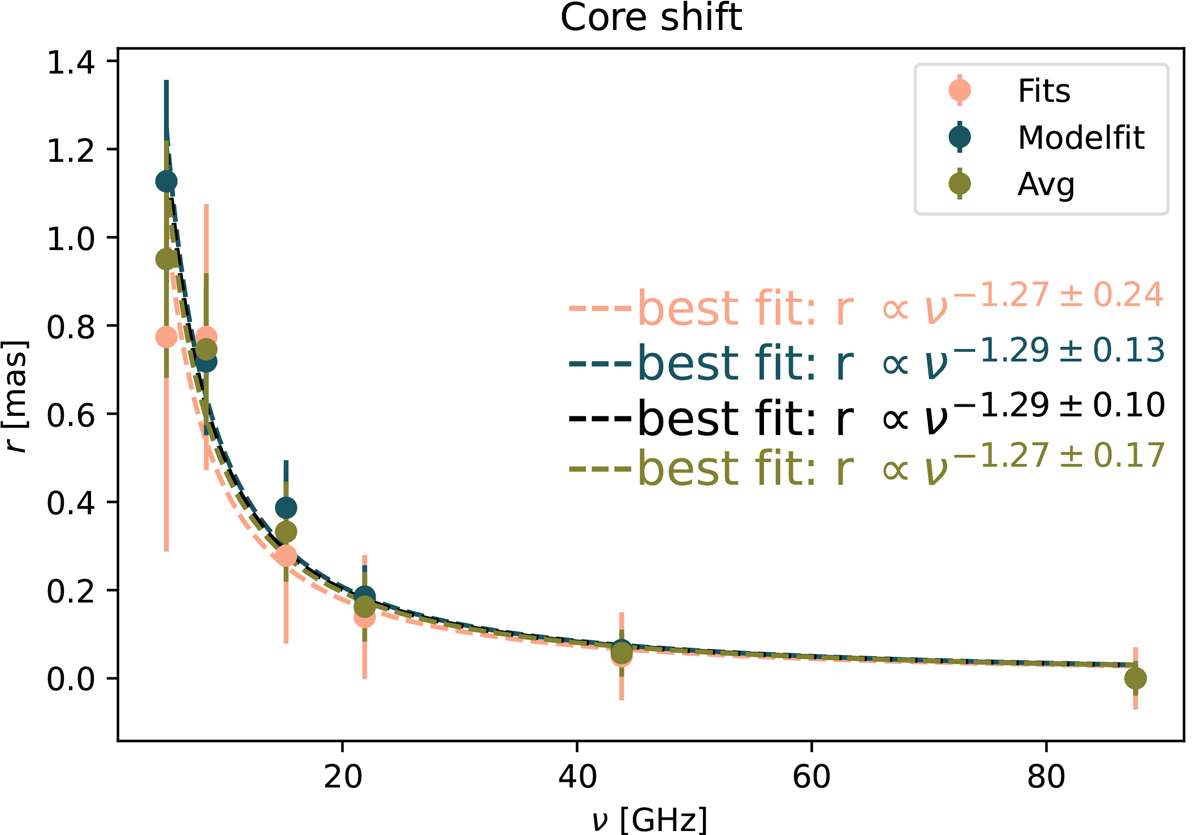
Fig. 2.
Download original image
Core-shift effect for 3C 111 between all six frequencies taken into account in this work (from 5 GHz to 87.6 GHz). The different colors represent the different methods used to estimate the core shift, as is explained in Sect. 3.2. The black line, r ∝ ν−1.29 ± 0.10, represents a fit of all the points together. The fit performed with the AVG data points gives r ∝ ν−1.27 ± 0.17, implying that kr = 0.79 ± 0.17. This result is suggestive of a mild dominance of the particle over the magnetic field, in the energy budget.
Current usage metrics show cumulative count of Article Views (full-text article views including HTML views, PDF and ePub downloads, according to the available data) and Abstracts Views on Vision4Press platform.
Data correspond to usage on the plateform after 2015. The current usage metrics is available 48-96 hours after online publication and is updated daily on week days.
Initial download of the metrics may take a while.