Fig. 9
Download original image
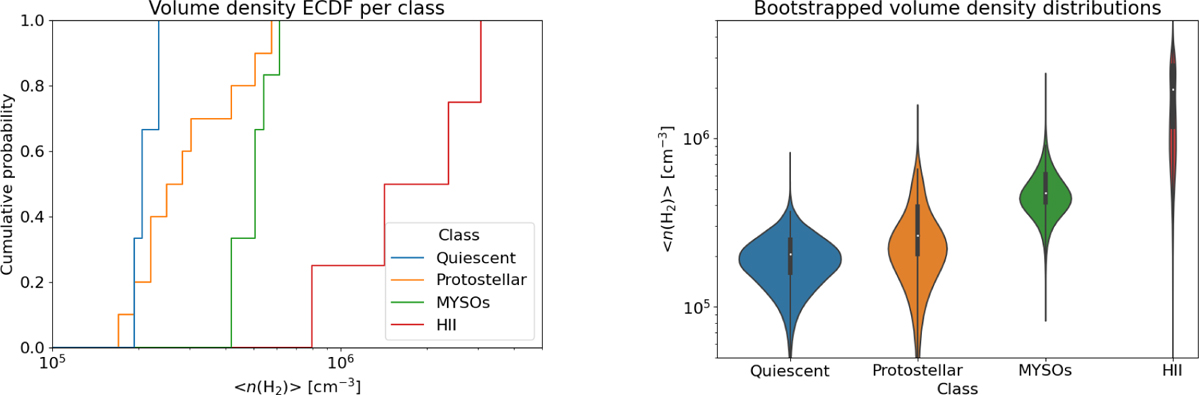
Left: empirical cumulative distribution functions of the best-fit density for each evolutionary class in the TOP 100 sample. Right: violin plot of the bootstrapped density distribution per class; 10 000 samples have been drawn for each source from the inferred number density posterior. The combined PDF, determined via a KDE smoothing, is shown around the quartiles and whiskers of a box plot.
Current usage metrics show cumulative count of Article Views (full-text article views including HTML views, PDF and ePub downloads, according to the available data) and Abstracts Views on Vision4Press platform.
Data correspond to usage on the plateform after 2015. The current usage metrics is available 48-96 hours after online publication and is updated daily on week days.
Initial download of the metrics may take a while.