Fig. 5
Download original image
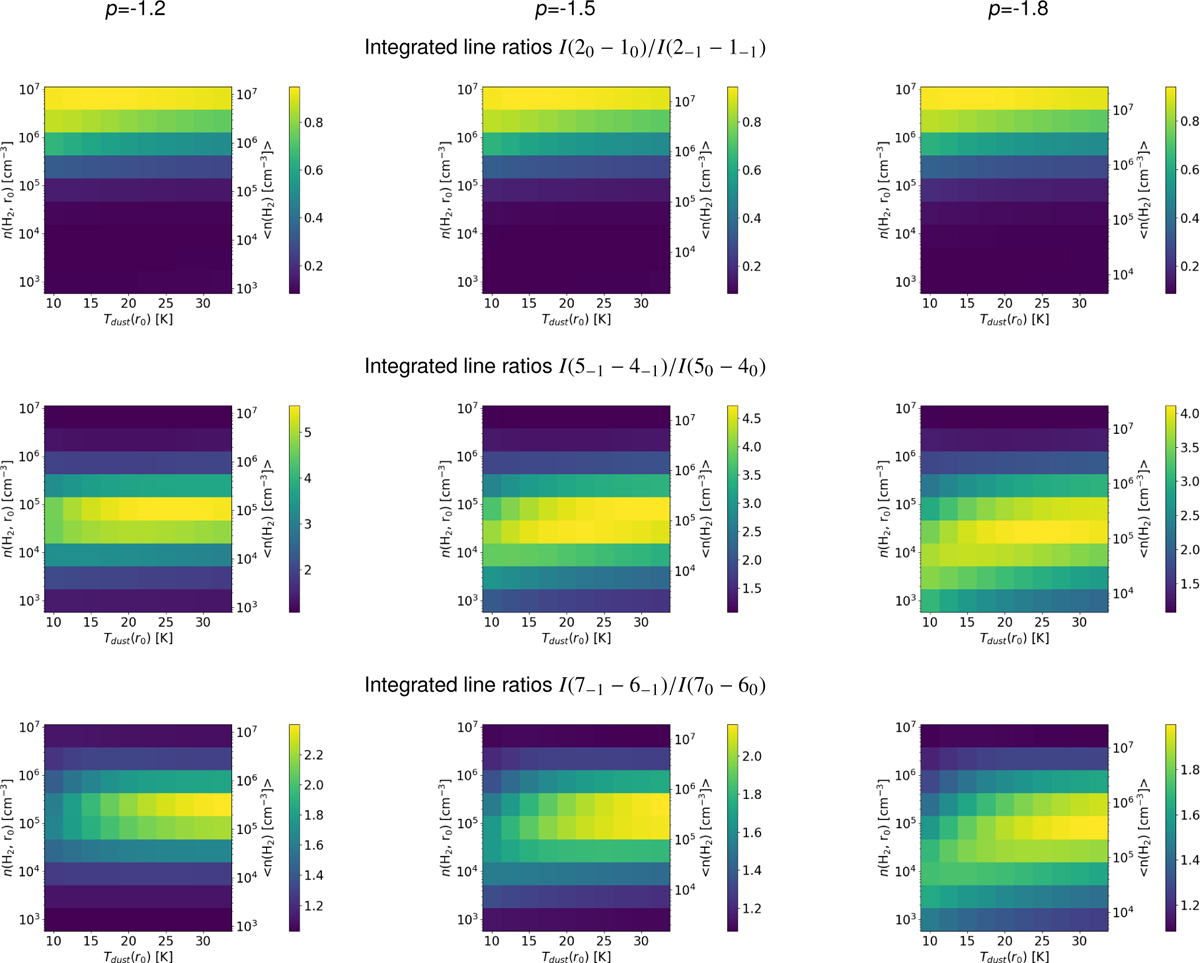
Comparison of the integrated line ratios for different density distributions, corresponding to the three grids considered in the case of internally heated clumps. The columns of plots refer to the values of p indicated at the top of each column. We only show the I(21 − 11)/I(20 − 10) for the 3 mm lines, because all three have the same behaviour.
Current usage metrics show cumulative count of Article Views (full-text article views including HTML views, PDF and ePub downloads, according to the available data) and Abstracts Views on Vision4Press platform.
Data correspond to usage on the plateform after 2015. The current usage metrics is available 48-96 hours after online publication and is updated daily on week days.
Initial download of the metrics may take a while.