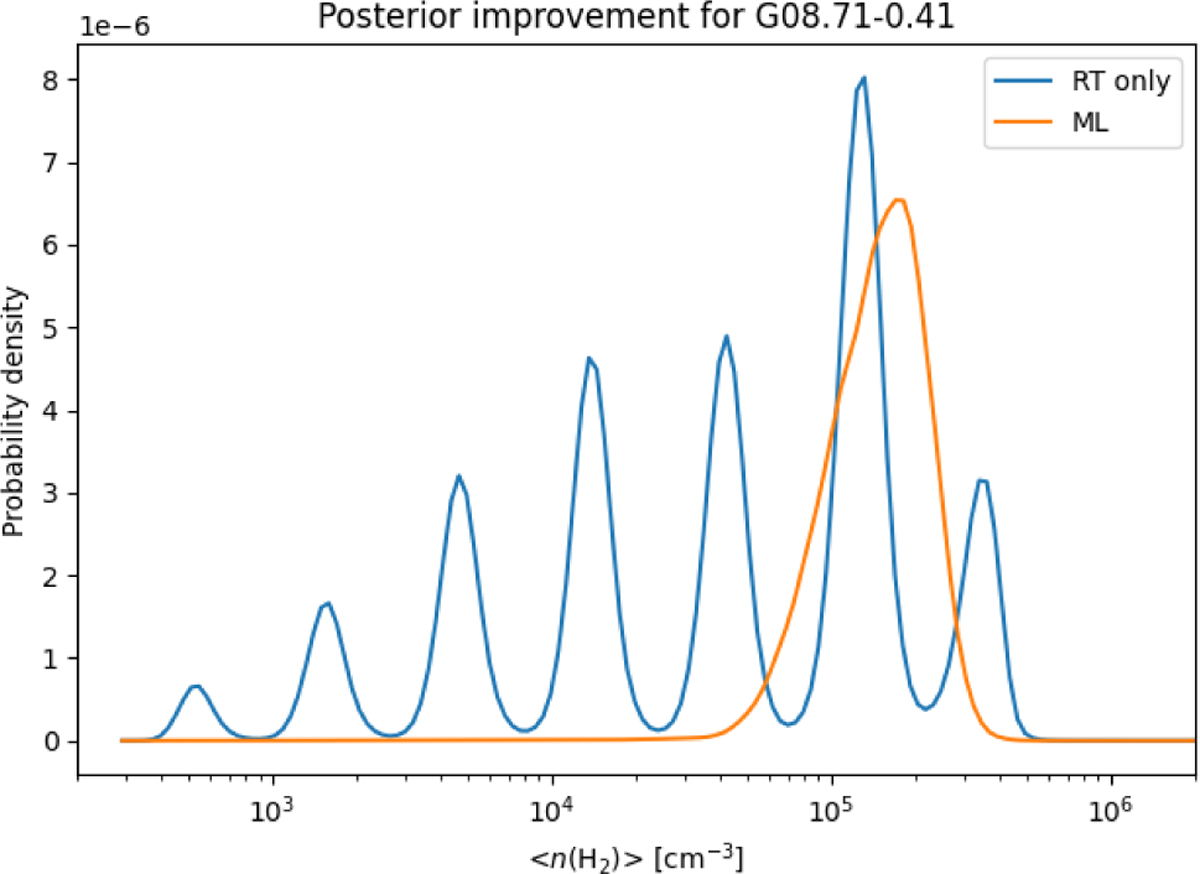
Fig. 4
Download original image
Improvement in the final number density posterior when adding ML-emulated data. In blue, a source displaying oscillations in the posterior is shown for the RT-only case; in orange, the same source with the number density posterior evaluated on the finer grid, generated by our final ML model. The oscillations caused by grid sparsity disappear.
Current usage metrics show cumulative count of Article Views (full-text article views including HTML views, PDF and ePub downloads, according to the available data) and Abstracts Views on Vision4Press platform.
Data correspond to usage on the plateform after 2015. The current usage metrics is available 48-96 hours after online publication and is updated daily on week days.
Initial download of the metrics may take a while.