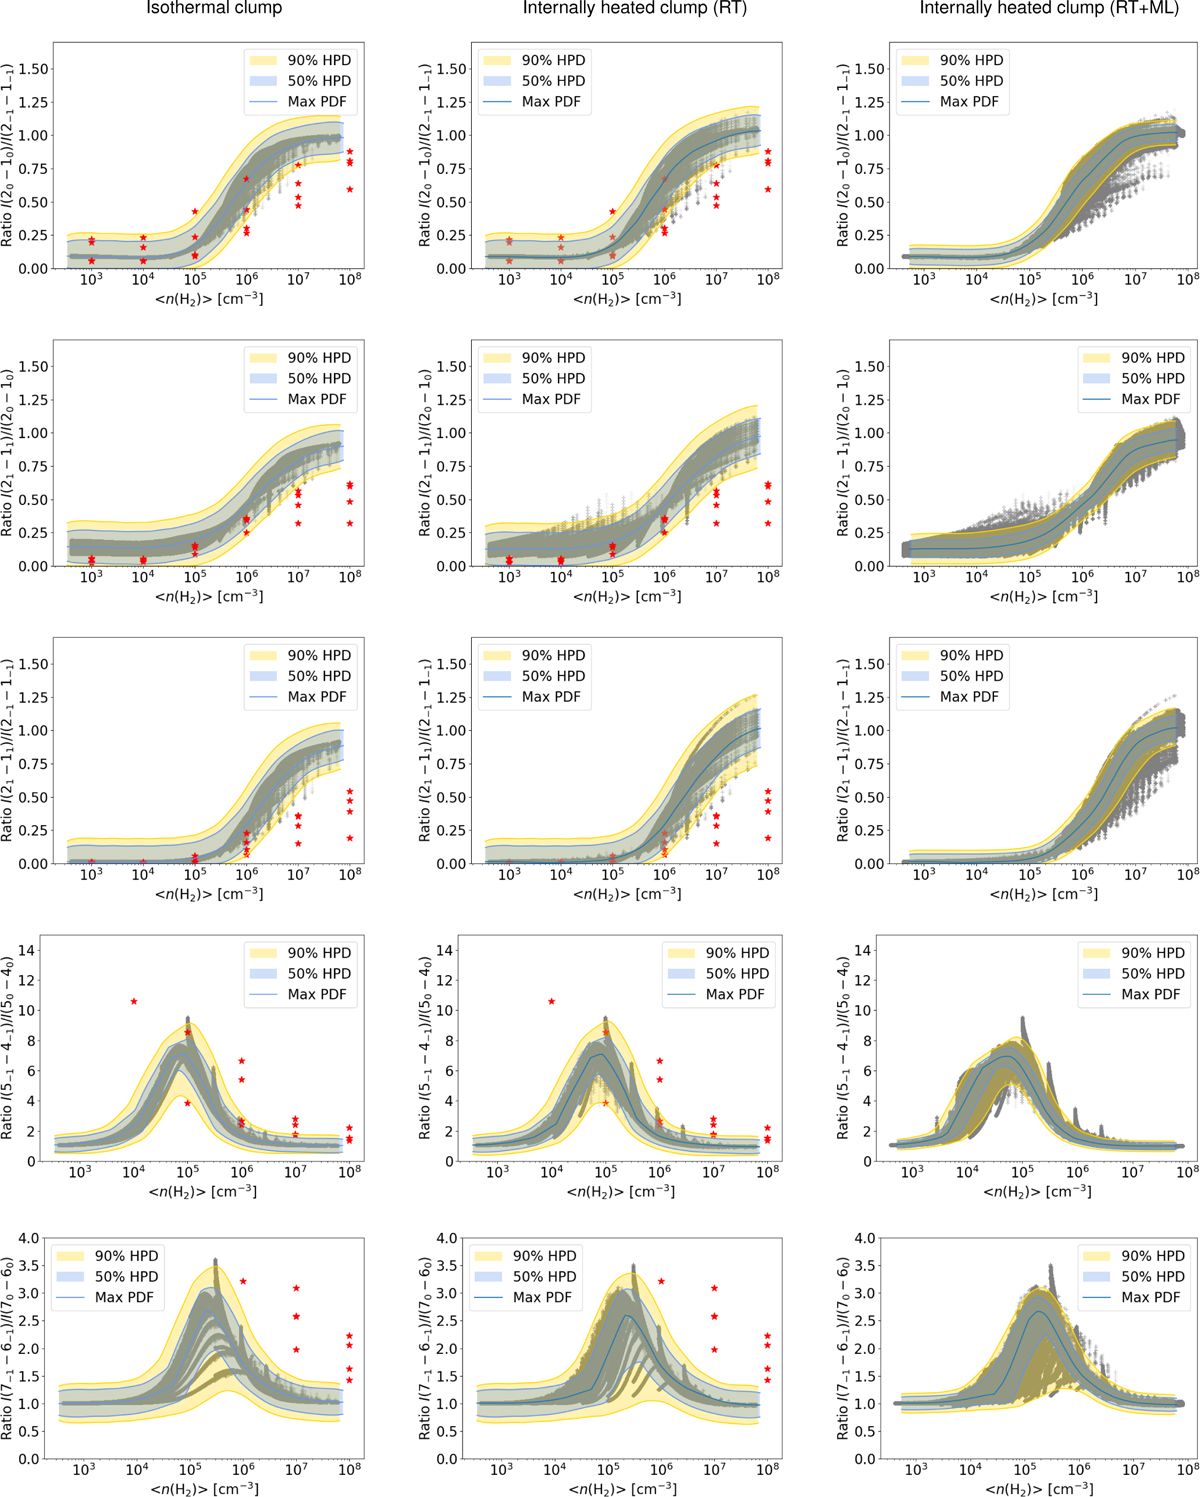
Fig. 3
Download original image
Kernel density estimate of the probability density function for the line ratios as a function of average number density along the LOS, for all the temperatures considered in the grid, for the model assumptions indicated at the top of each column. The rows show the ratios I(20 − 10)/I(2−1 − 1−1), I(21 − 11)/I(20 − 10), I(21 − 11)/I(2−1 − 1−1), I(5−1 − 4−1)/I(50 − 40), and I(7−1 − 6−1)/I(70 − 60), in order, from top to bottom. RADEX computations for an isothermal, uniform clump are shown as red stars; the parameters used are described in the text. Note that for the I(5−1 − 4−1)/I(50 − 40), and I(7−1 − 6−1)/I(70 − 60) ratios the RADEX points at low densities are above the plotting limits, and reach values around 25 in both cases.
Current usage metrics show cumulative count of Article Views (full-text article views including HTML views, PDF and ePub downloads, according to the available data) and Abstracts Views on Vision4Press platform.
Data correspond to usage on the plateform after 2015. The current usage metrics is available 48-96 hours after online publication and is updated daily on week days.
Initial download of the metrics may take a while.