Fig. 2
Download original image
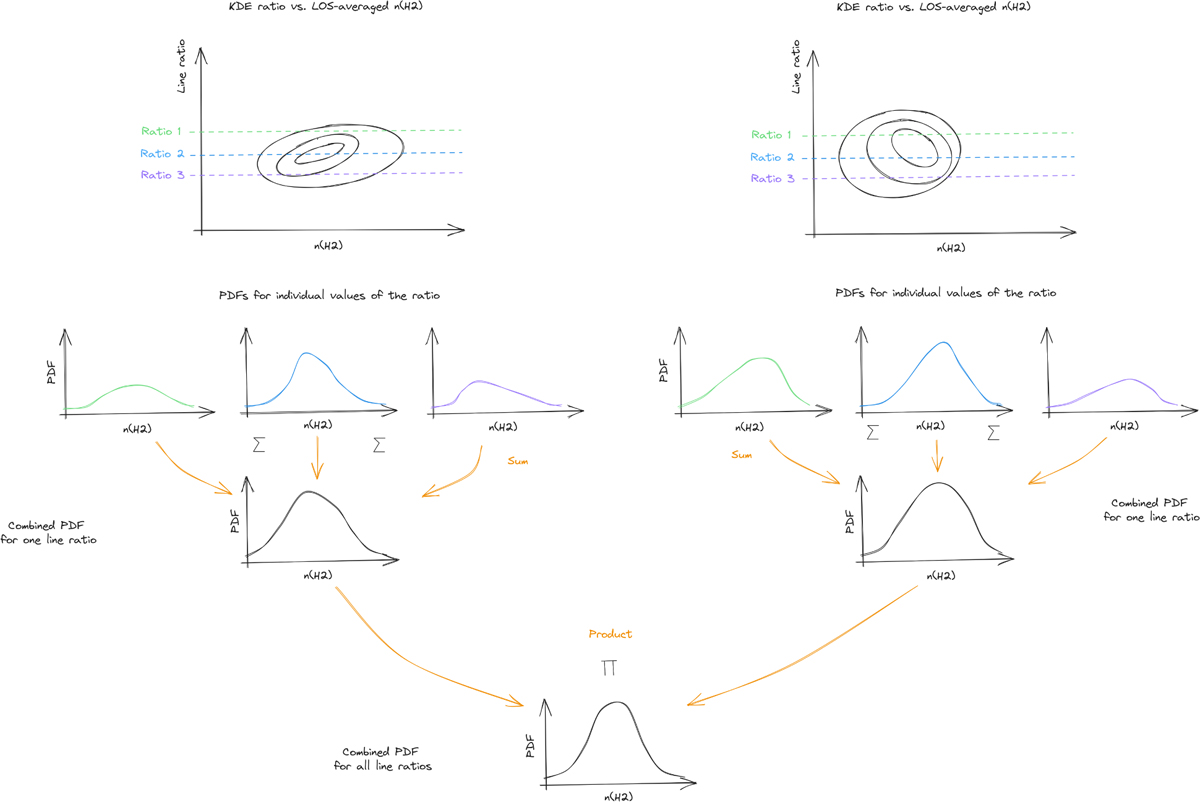
Schema of the procedure to derive the final density posterior from the combination of several line ratios. Two distinct ratios are considered in this example, the relations of which with n(H2) are shown in the top row. After generating a number of ratios, according to observations and uncertainties, the PDFs of individual ratios are summed, and then the resulting distribution for each line ratio is multiplied to obtain the final number density posterior.
Current usage metrics show cumulative count of Article Views (full-text article views including HTML views, PDF and ePub downloads, according to the available data) and Abstracts Views on Vision4Press platform.
Data correspond to usage on the plateform after 2015. The current usage metrics is available 48-96 hours after online publication and is updated daily on week days.
Initial download of the metrics may take a while.