Fig. C.5
Download original image
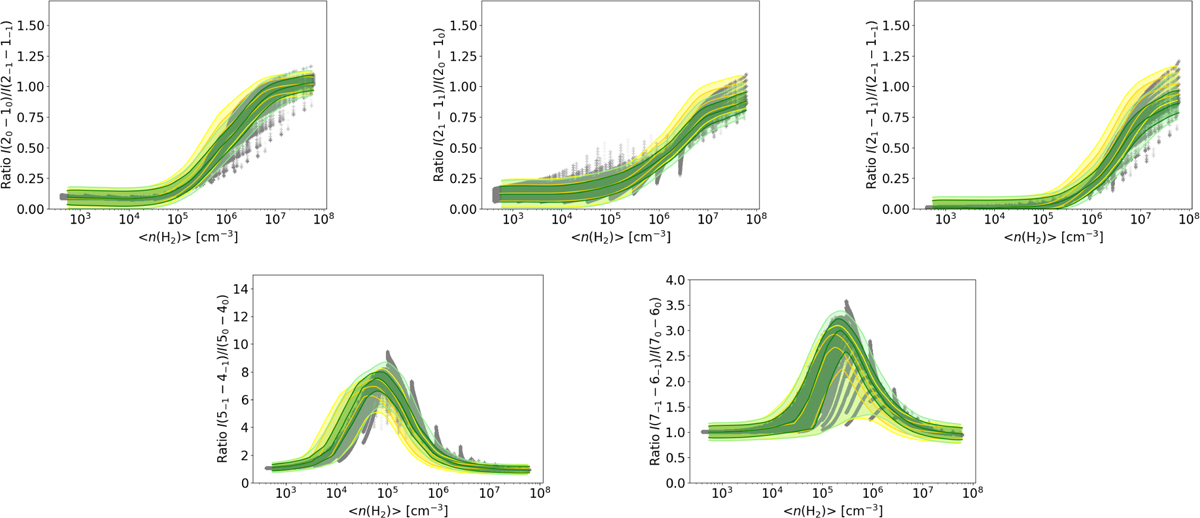
Kernel density estimate of the probability density function for the line ratios as a function of temperature and average number density along the LOS, for the internally heated clump case with a density distribution ∝ r−1.5, and a doubled microturbulence level, for lines at around 96.7 GHz (top row, for line ratios I(20 − 10)/I(2−1 − 1−1), I(21 − 11)/I(20 − 10), and I(21 − 11)/I(2−1 − 1−1)), those at around 241.7 GHz (bottom left, ratio I(5−1 − 4−1)/I(50 − 40)), and around 338.1 GHz (bottom right, ratio I(7−1 − 6−1)/I(70 − 60)). The results for the fiducial values of microturbulence are shown in yellow, for reference.
Current usage metrics show cumulative count of Article Views (full-text article views including HTML views, PDF and ePub downloads, according to the available data) and Abstracts Views on Vision4Press platform.
Data correspond to usage on the plateform after 2015. The current usage metrics is available 48-96 hours after online publication and is updated daily on week days.
Initial download of the metrics may take a while.