Open Access
Fig. C.3
Download original image
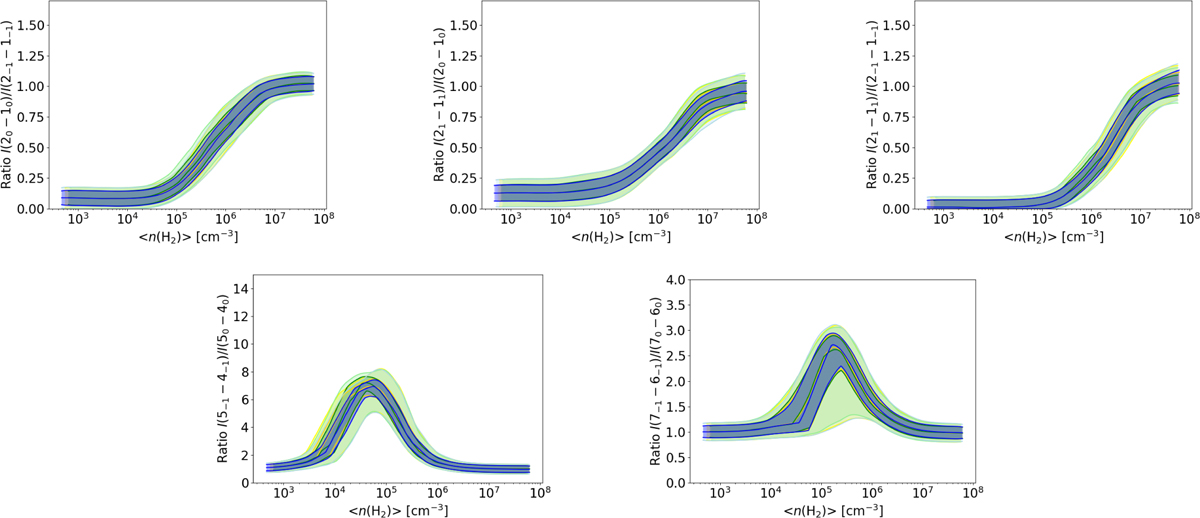
Comparison between the relations when using a different power-law distribution for density. The green-shaded region corresponds to p = −1.2, the yellow one to p = −1.5, while the blue area refers to p = −1.8.
Current usage metrics show cumulative count of Article Views (full-text article views including HTML views, PDF and ePub downloads, according to the available data) and Abstracts Views on Vision4Press platform.
Data correspond to usage on the plateform after 2015. The current usage metrics is available 48-96 hours after online publication and is updated daily on week days.
Initial download of the metrics may take a while.