Fig. 1.
Download original image
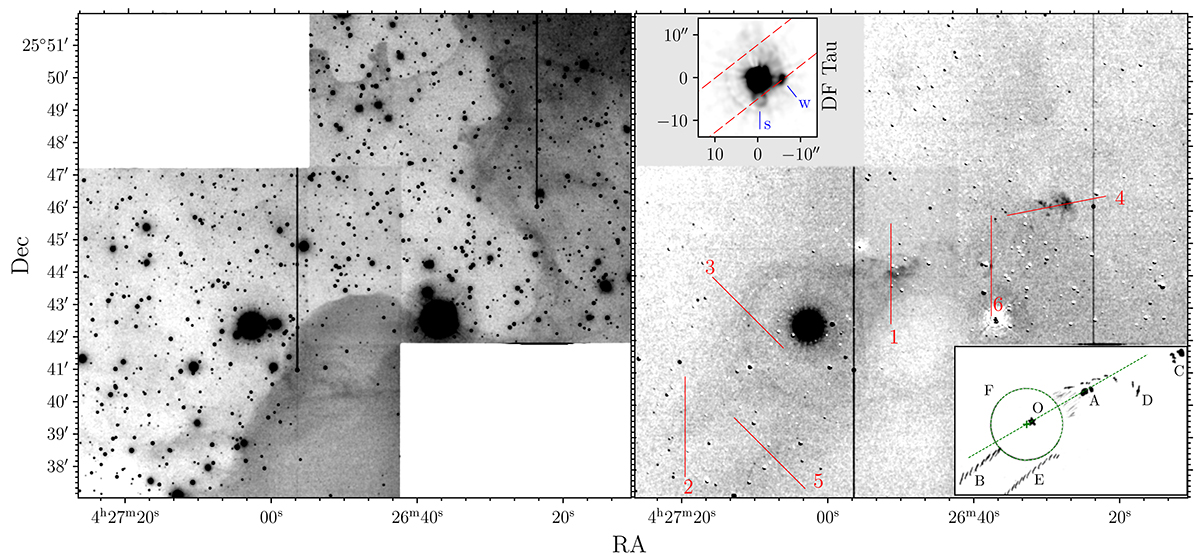
Vicinity of DF Tau in the continuum band Halpbc (left panel) and the difference between images in the Halp 656 nm and Halpbc filters (right panel). Red segments indicate the position and orientation of the TDS slits. The close vicinity of DF Tau is highlighted in a 10″ × 10″ subimage located in the upper-left part of the panel. Red dashed lines mark the edges of the 10″-slit used for TDS observation at rJD = 588.6, and southern (s) and western (w) blobs are marked with blue lines. The diagram in the lower-right part of the panel illustrates the nomenclature of nebulae designations used in the text: O – DF Tau; green line – micro jet direction (PA = −59°); A – the first group of bright HH objects; B – counter-jet, C – the second group of bright HH objects; D – the brightest HH object (∼3 × 10⁻¹⁶ erg s−1 Å−1 cm−2 arcsec−2); E – the rim; F – the ring, whose center is marked by a green cross near DF Tau.
Current usage metrics show cumulative count of Article Views (full-text article views including HTML views, PDF and ePub downloads, according to the available data) and Abstracts Views on Vision4Press platform.
Data correspond to usage on the plateform after 2015. The current usage metrics is available 48-96 hours after online publication and is updated daily on week days.
Initial download of the metrics may take a while.