Fig. B.1.
Download original image
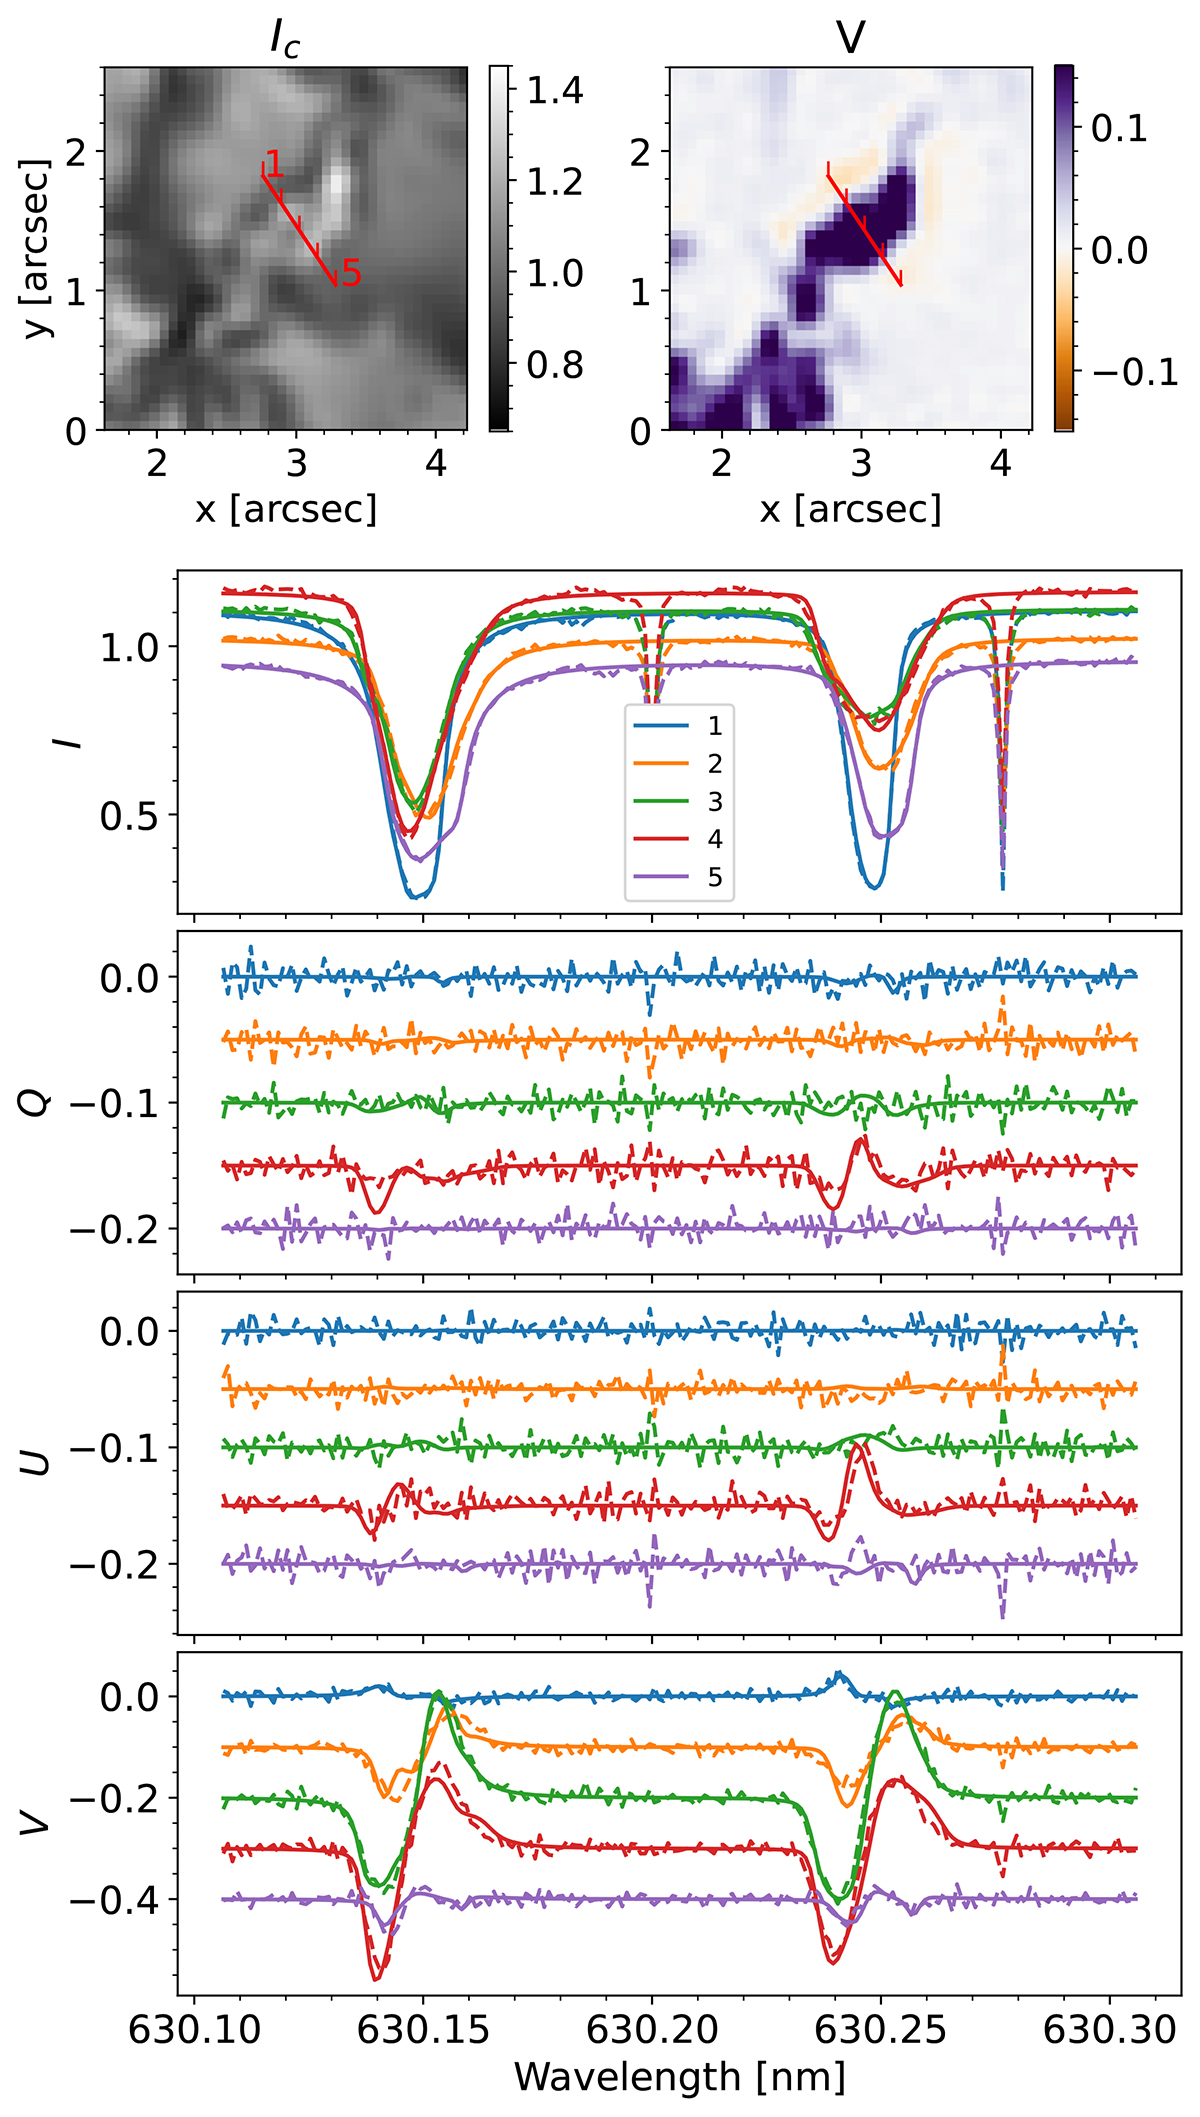
Top: Continuum intensity (left) and the Stokes V in the line wing (right) in the ROI at the time t = 600 s with respect to the start of the observations. Bottom four panels: Stokes I, Q, U, V at the five selected locations. Stokes Q, U, V have been offset vertically for clarity. Dashed and full lines denote observed and FIRTEZ-fitted spectra. All Stokes components are normalized to the continuum at the quiet Sun at the disk center.
Current usage metrics show cumulative count of Article Views (full-text article views including HTML views, PDF and ePub downloads, according to the available data) and Abstracts Views on Vision4Press platform.
Data correspond to usage on the plateform after 2015. The current usage metrics is available 48-96 hours after online publication and is updated daily on week days.
Initial download of the metrics may take a while.