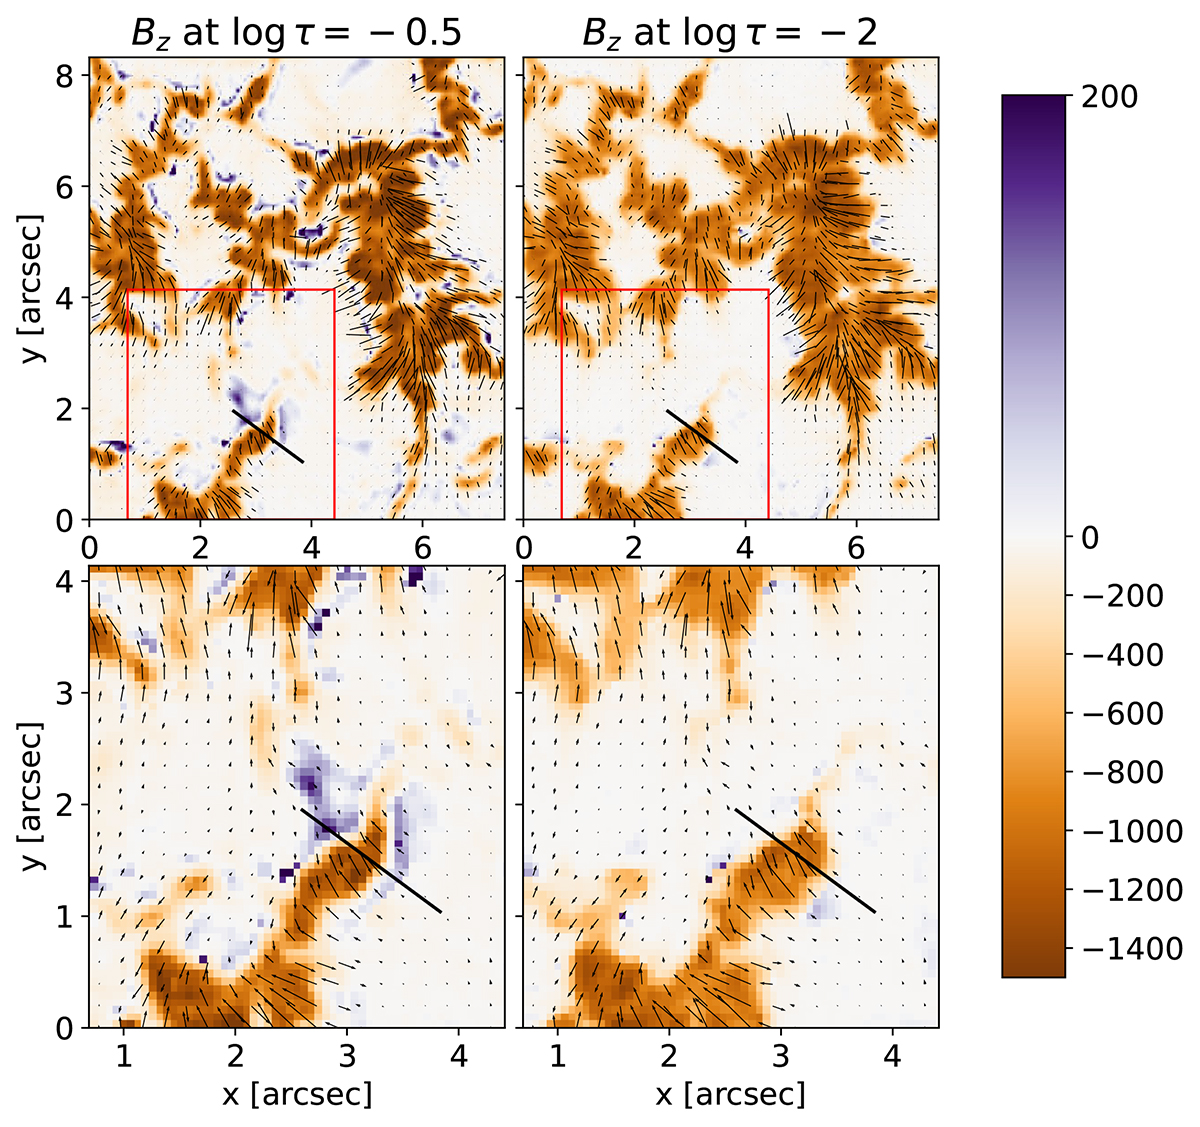
Fig. 3.
Download original image
Magnetic field maps at the layer corresponding to log τ = −0.5 and log τ = −2. The color maps correspond to the vertical component and the arrows to the horizontal component of the magnetic field vector. The lower two panels show a zoom-in of the area denoted by the red rectangle in the upper two panels. The black line corresponds to the vertical slice shown in Fig. 4. The color-bar scale for Bz is asymmetric.
Current usage metrics show cumulative count of Article Views (full-text article views including HTML views, PDF and ePub downloads, according to the available data) and Abstracts Views on Vision4Press platform.
Data correspond to usage on the plateform after 2015. The current usage metrics is available 48-96 hours after online publication and is updated daily on week days.
Initial download of the metrics may take a while.