Fig. A.1.
Download original image
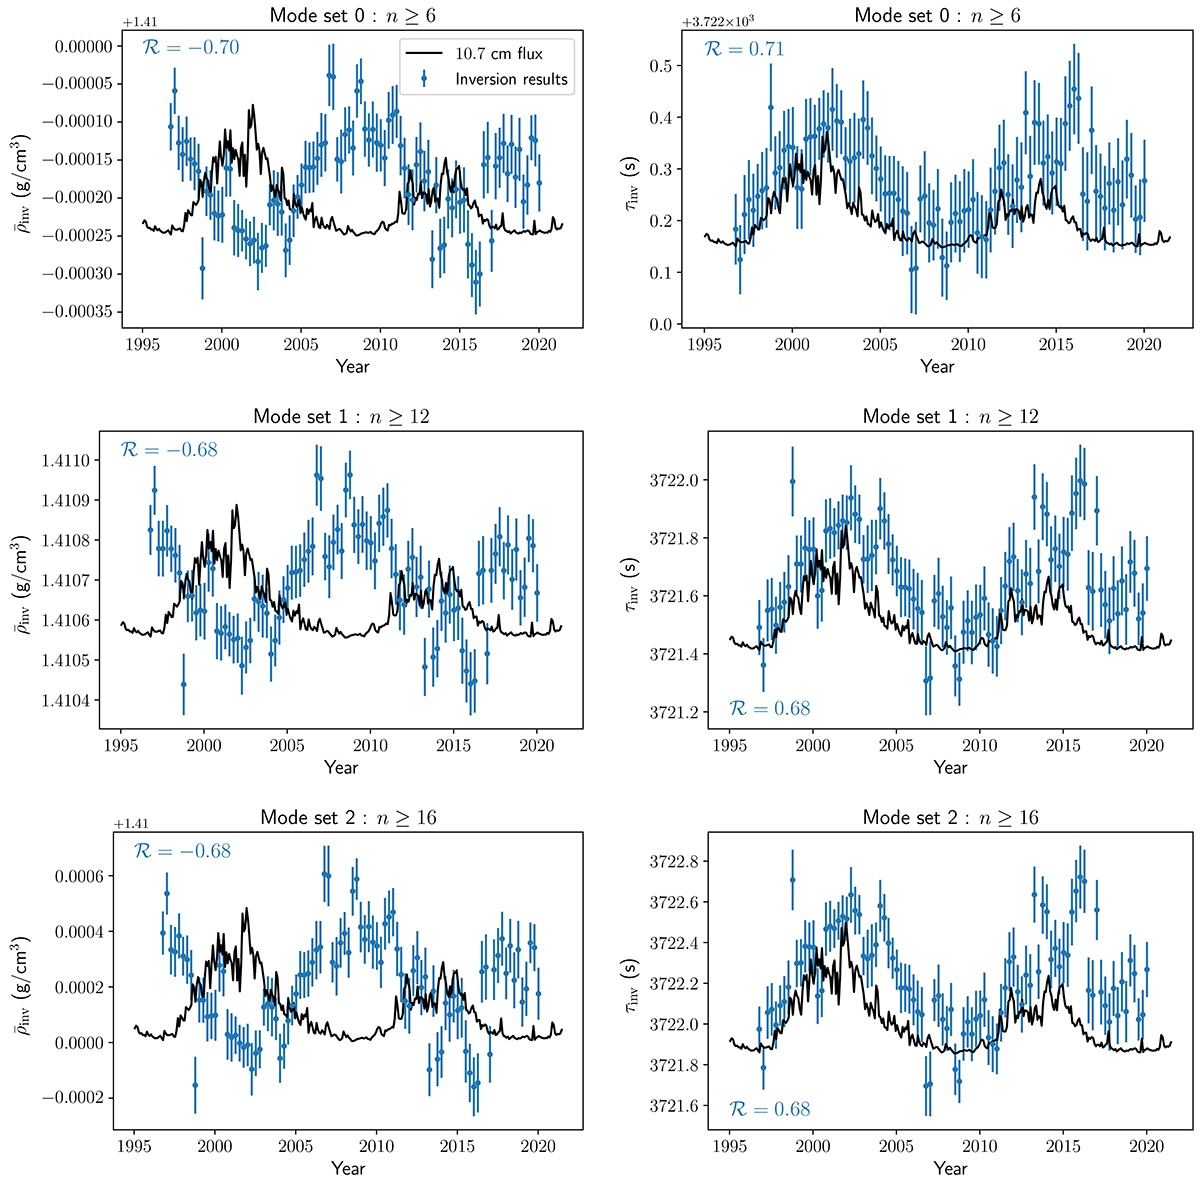
Results of the consistency tests assessing the effectiveness of the automation of the InversionKit software for the mean density (left column) and acoustic radius (right column) inversions. The number ℛ denotes the Spearman correlation coefficient between the dataset (in blue) and the activity proxy (solid black line), the 10.7 cm radio emission flux. The activity proxy was rescaled for illustration purposes.
Current usage metrics show cumulative count of Article Views (full-text article views including HTML views, PDF and ePub downloads, according to the available data) and Abstracts Views on Vision4Press platform.
Data correspond to usage on the plateform after 2015. The current usage metrics is available 48-96 hours after online publication and is updated daily on week days.
Initial download of the metrics may take a while.