Fig. 3.
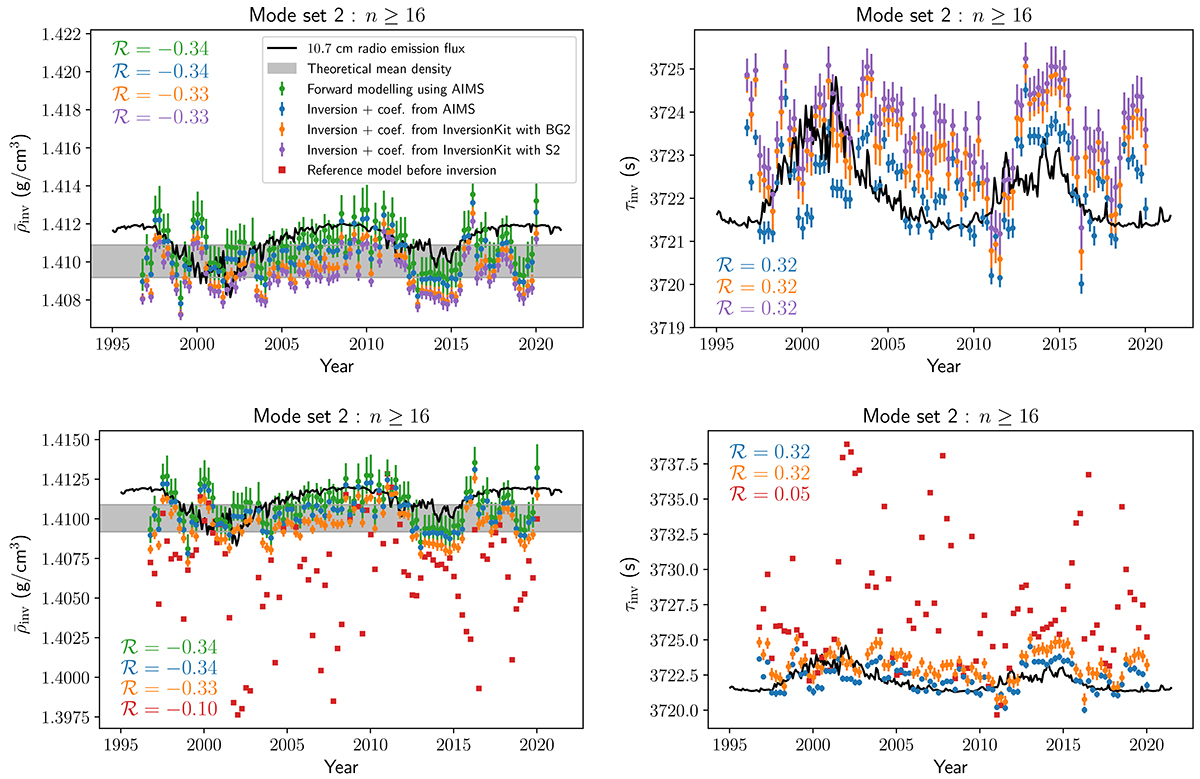
Download original image
Upper panels: Impact of surface effect prescription on mean density (left column) and acoustic radius (right column) inversions. Lower panels: Mean density (left column) and acoustic radius (right column) inversion performances. These tests are based on mode set 2 with GOLF data. The activity proxy, the 10.7 cm radio emission flux, is represented by the solid black line. It was rescaled for illustration purposes and reversed in the event of a negative correlation (left column). The gray band is the 1σ interval for the theoretical mean density computed from the solar total mass M⊙ and radius R⊙. The number ℛ denotes the Spearman correlation coefficient between the activity proxy and the corresponding dataset.
Current usage metrics show cumulative count of Article Views (full-text article views including HTML views, PDF and ePub downloads, according to the available data) and Abstracts Views on Vision4Press platform.
Data correspond to usage on the plateform after 2015. The current usage metrics is available 48-96 hours after online publication and is updated daily on week days.
Initial download of the metrics may take a while.