Fig. 2.
Download original image
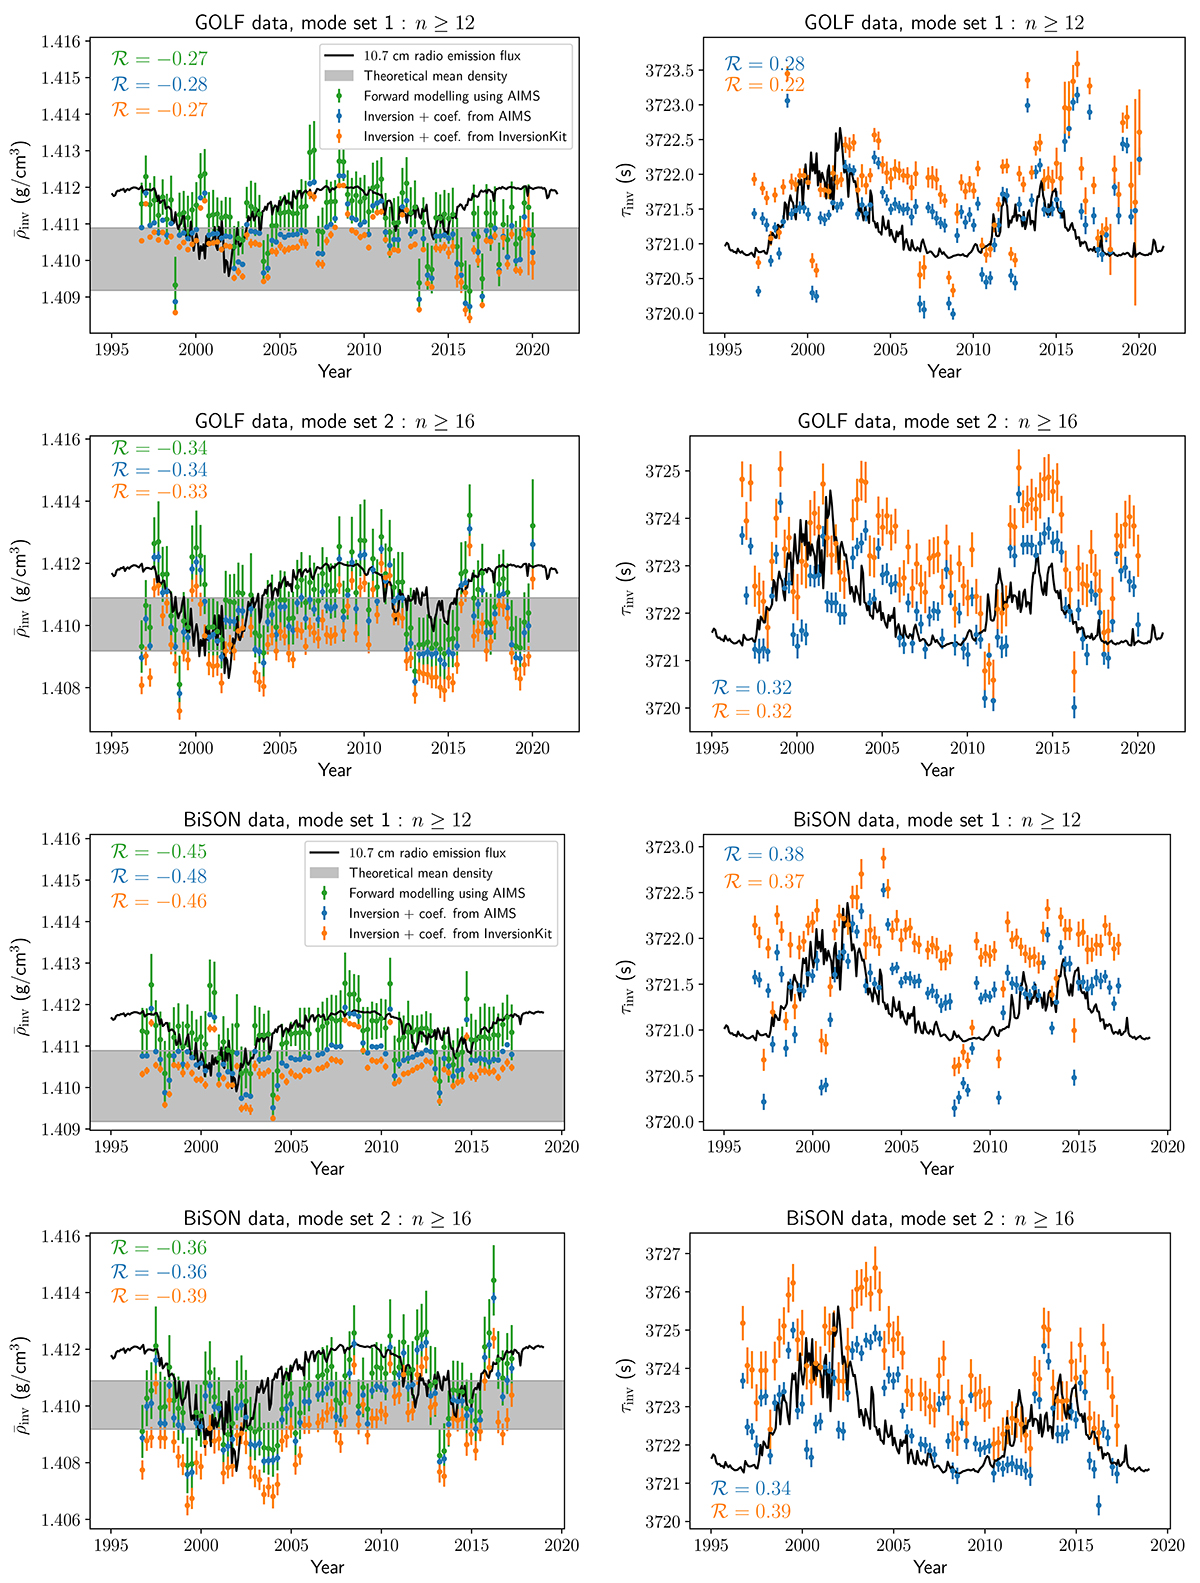
Impact of the magnetic activity cycle on mean density (left column) and acoustic radius (right column) inversions based on GOLF (upper half) and BiSON (lower half) data. The results from the forward modelling are displayed in green. The forward modelling results are shown in green, while the inversion results are illustrated in blue and orange, depending on whether the surface effect coefficients are derived from AIMS or InversionKit. The activity proxy, the 10.7 cm radio emission flux, is represented by the solid black line. For illustration purposes, this proxy was rescaled and reversed in cases of negative correlation (left column). The gray band is the 1σ interval for the theoretical mean density computed from the solar total mass M⊙ and radius R⊙. The number ℛ denotes the Spearman rank correlation coefficient between the activity proxy and the corresponding dataset.
Current usage metrics show cumulative count of Article Views (full-text article views including HTML views, PDF and ePub downloads, according to the available data) and Abstracts Views on Vision4Press platform.
Data correspond to usage on the plateform after 2015. The current usage metrics is available 48-96 hours after online publication and is updated daily on week days.
Initial download of the metrics may take a while.