Open Access
Fig. 5
Download original image
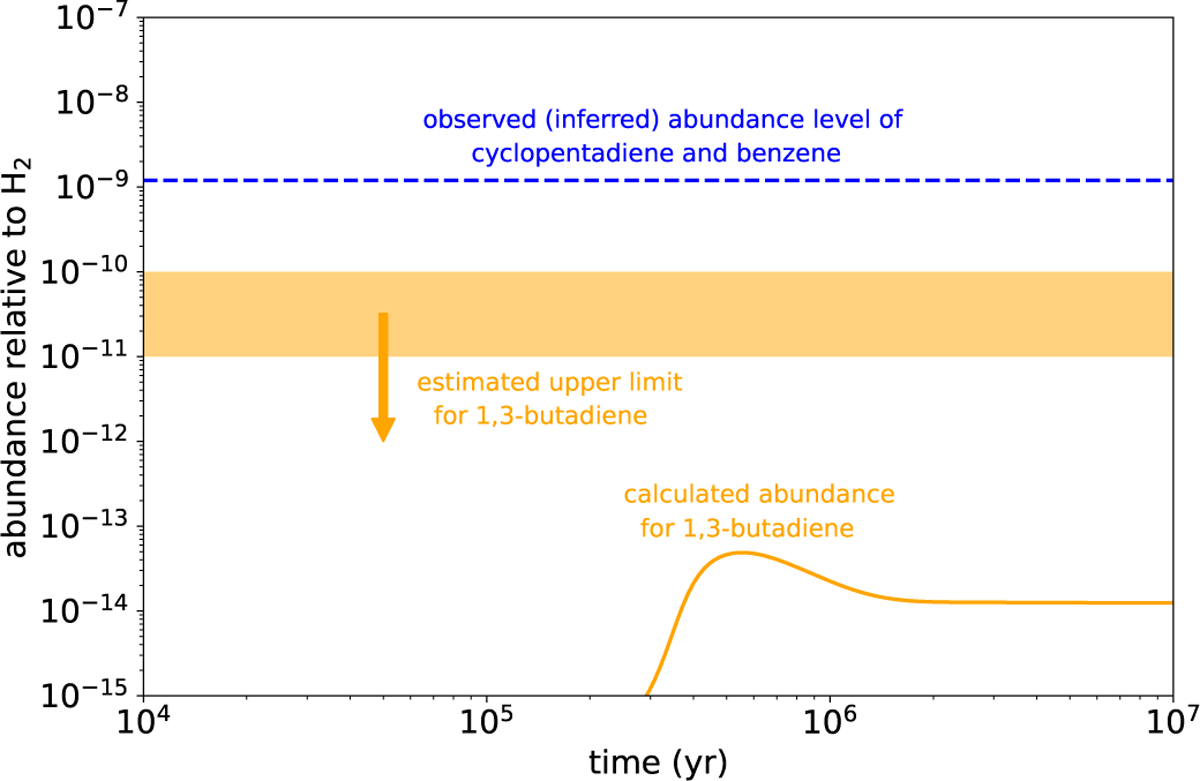
Abundance of 1,3-butadiene calculated by the chemical model as a function of time (solid orange curve), estimated observational upper limit on the abundance of 1,3-butadiene in TMC-1 (horizontal orange band), and abundance observed (or inferred) for cyclopentadiene and benzene in TMC-1.
Current usage metrics show cumulative count of Article Views (full-text article views including HTML views, PDF and ePub downloads, according to the available data) and Abstracts Views on Vision4Press platform.
Data correspond to usage on the plateform after 2015. The current usage metrics is available 48-96 hours after online publication and is updated daily on week days.
Initial download of the metrics may take a while.