Fig. 2
Download original image
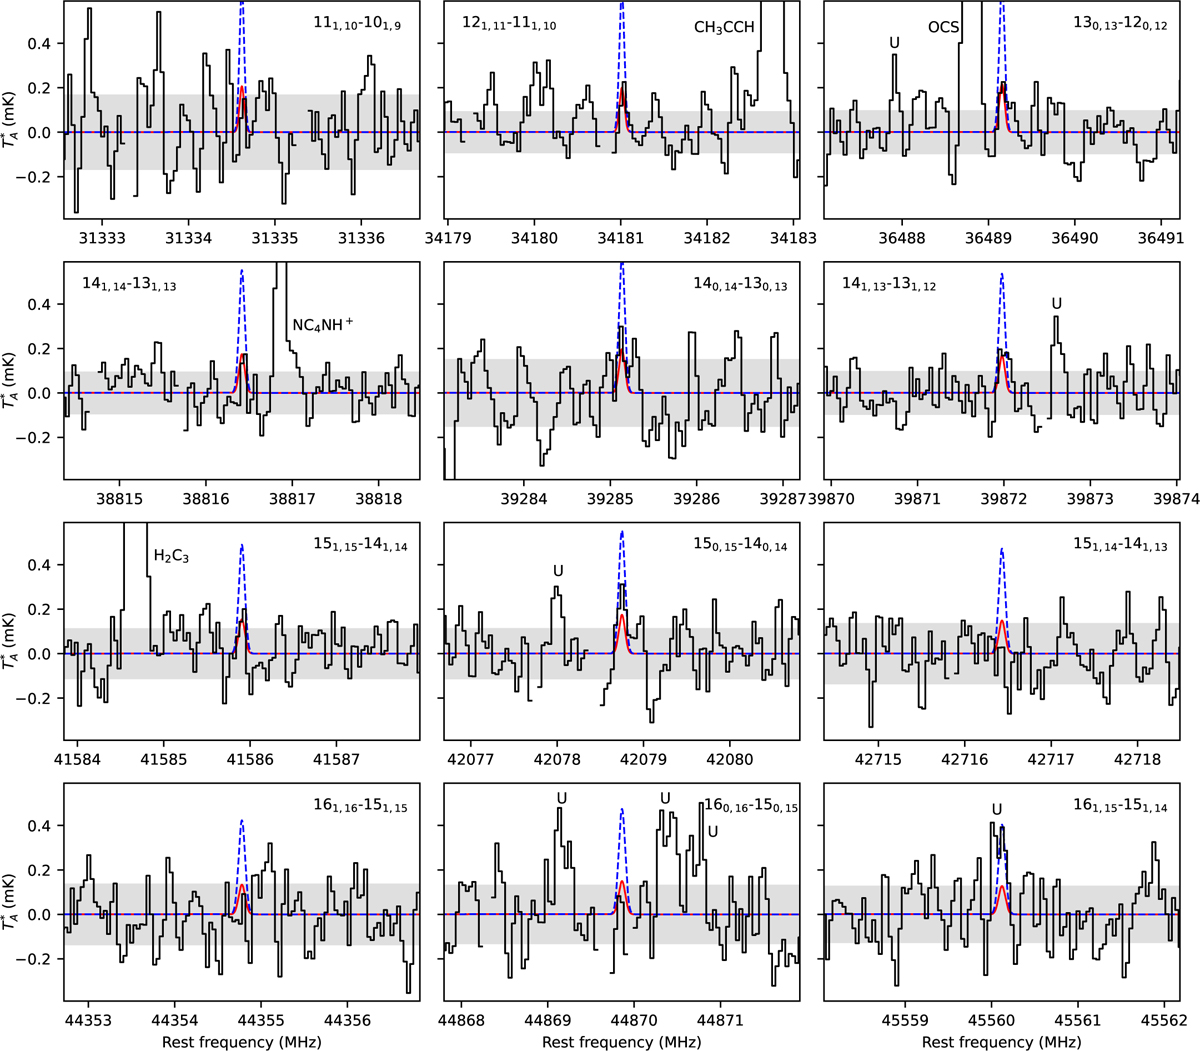
Spectra of TMC-1 in the Q band at the frequencies of the most favorable lines of E-1-cyano-1,3-butadiene. The noise level, as measured in a window of ± 8 MHz around the expected position of each line with the nominal spectral resolution of 38.15 kHz, is indicated by a gray horizontal band. The red lines correspond to the line intensities calculated adopting as column density for E-1-cyano-1,3-butadiene the 3 σ upper limit of 1.2 × 1010 cm−2 determined here, while the blue dashed lines correspond to the line intensities calculated adopting as column density the value of 3.8 × 1010 cm−2 determined by Cooke et al. (2023). Our data is clearly inconsistent with such a column density.
Current usage metrics show cumulative count of Article Views (full-text article views including HTML views, PDF and ePub downloads, according to the available data) and Abstracts Views on Vision4Press platform.
Data correspond to usage on the plateform after 2015. The current usage metrics is available 48-96 hours after online publication and is updated daily on week days.
Initial download of the metrics may take a while.